

The Small Cap Turnaround Trap: Why Statistical Precision Beats the Comeback Narrative
Osman Akgun, PhD, CFA
Senior Vice President, Domestic Equities
August 28, 2026
There’s an old Wall Street adage, “Don’t catch a falling knife.” And yet, turnaround investing is a deep-value strategy that seeks to buy the stocks of struggling, formerly successful companies to profit from their operational and financial recovery. Much more common in the volatile small cap space, turnaround investing requires identifying fundamentally sound businesses experiencing temporary distress and declining value (“falling knives”) on the expectation that the companies will turn things around. It’s a compelling story – and one that’s particularly likely to appeal to value investors. But the data doesn’t support it.
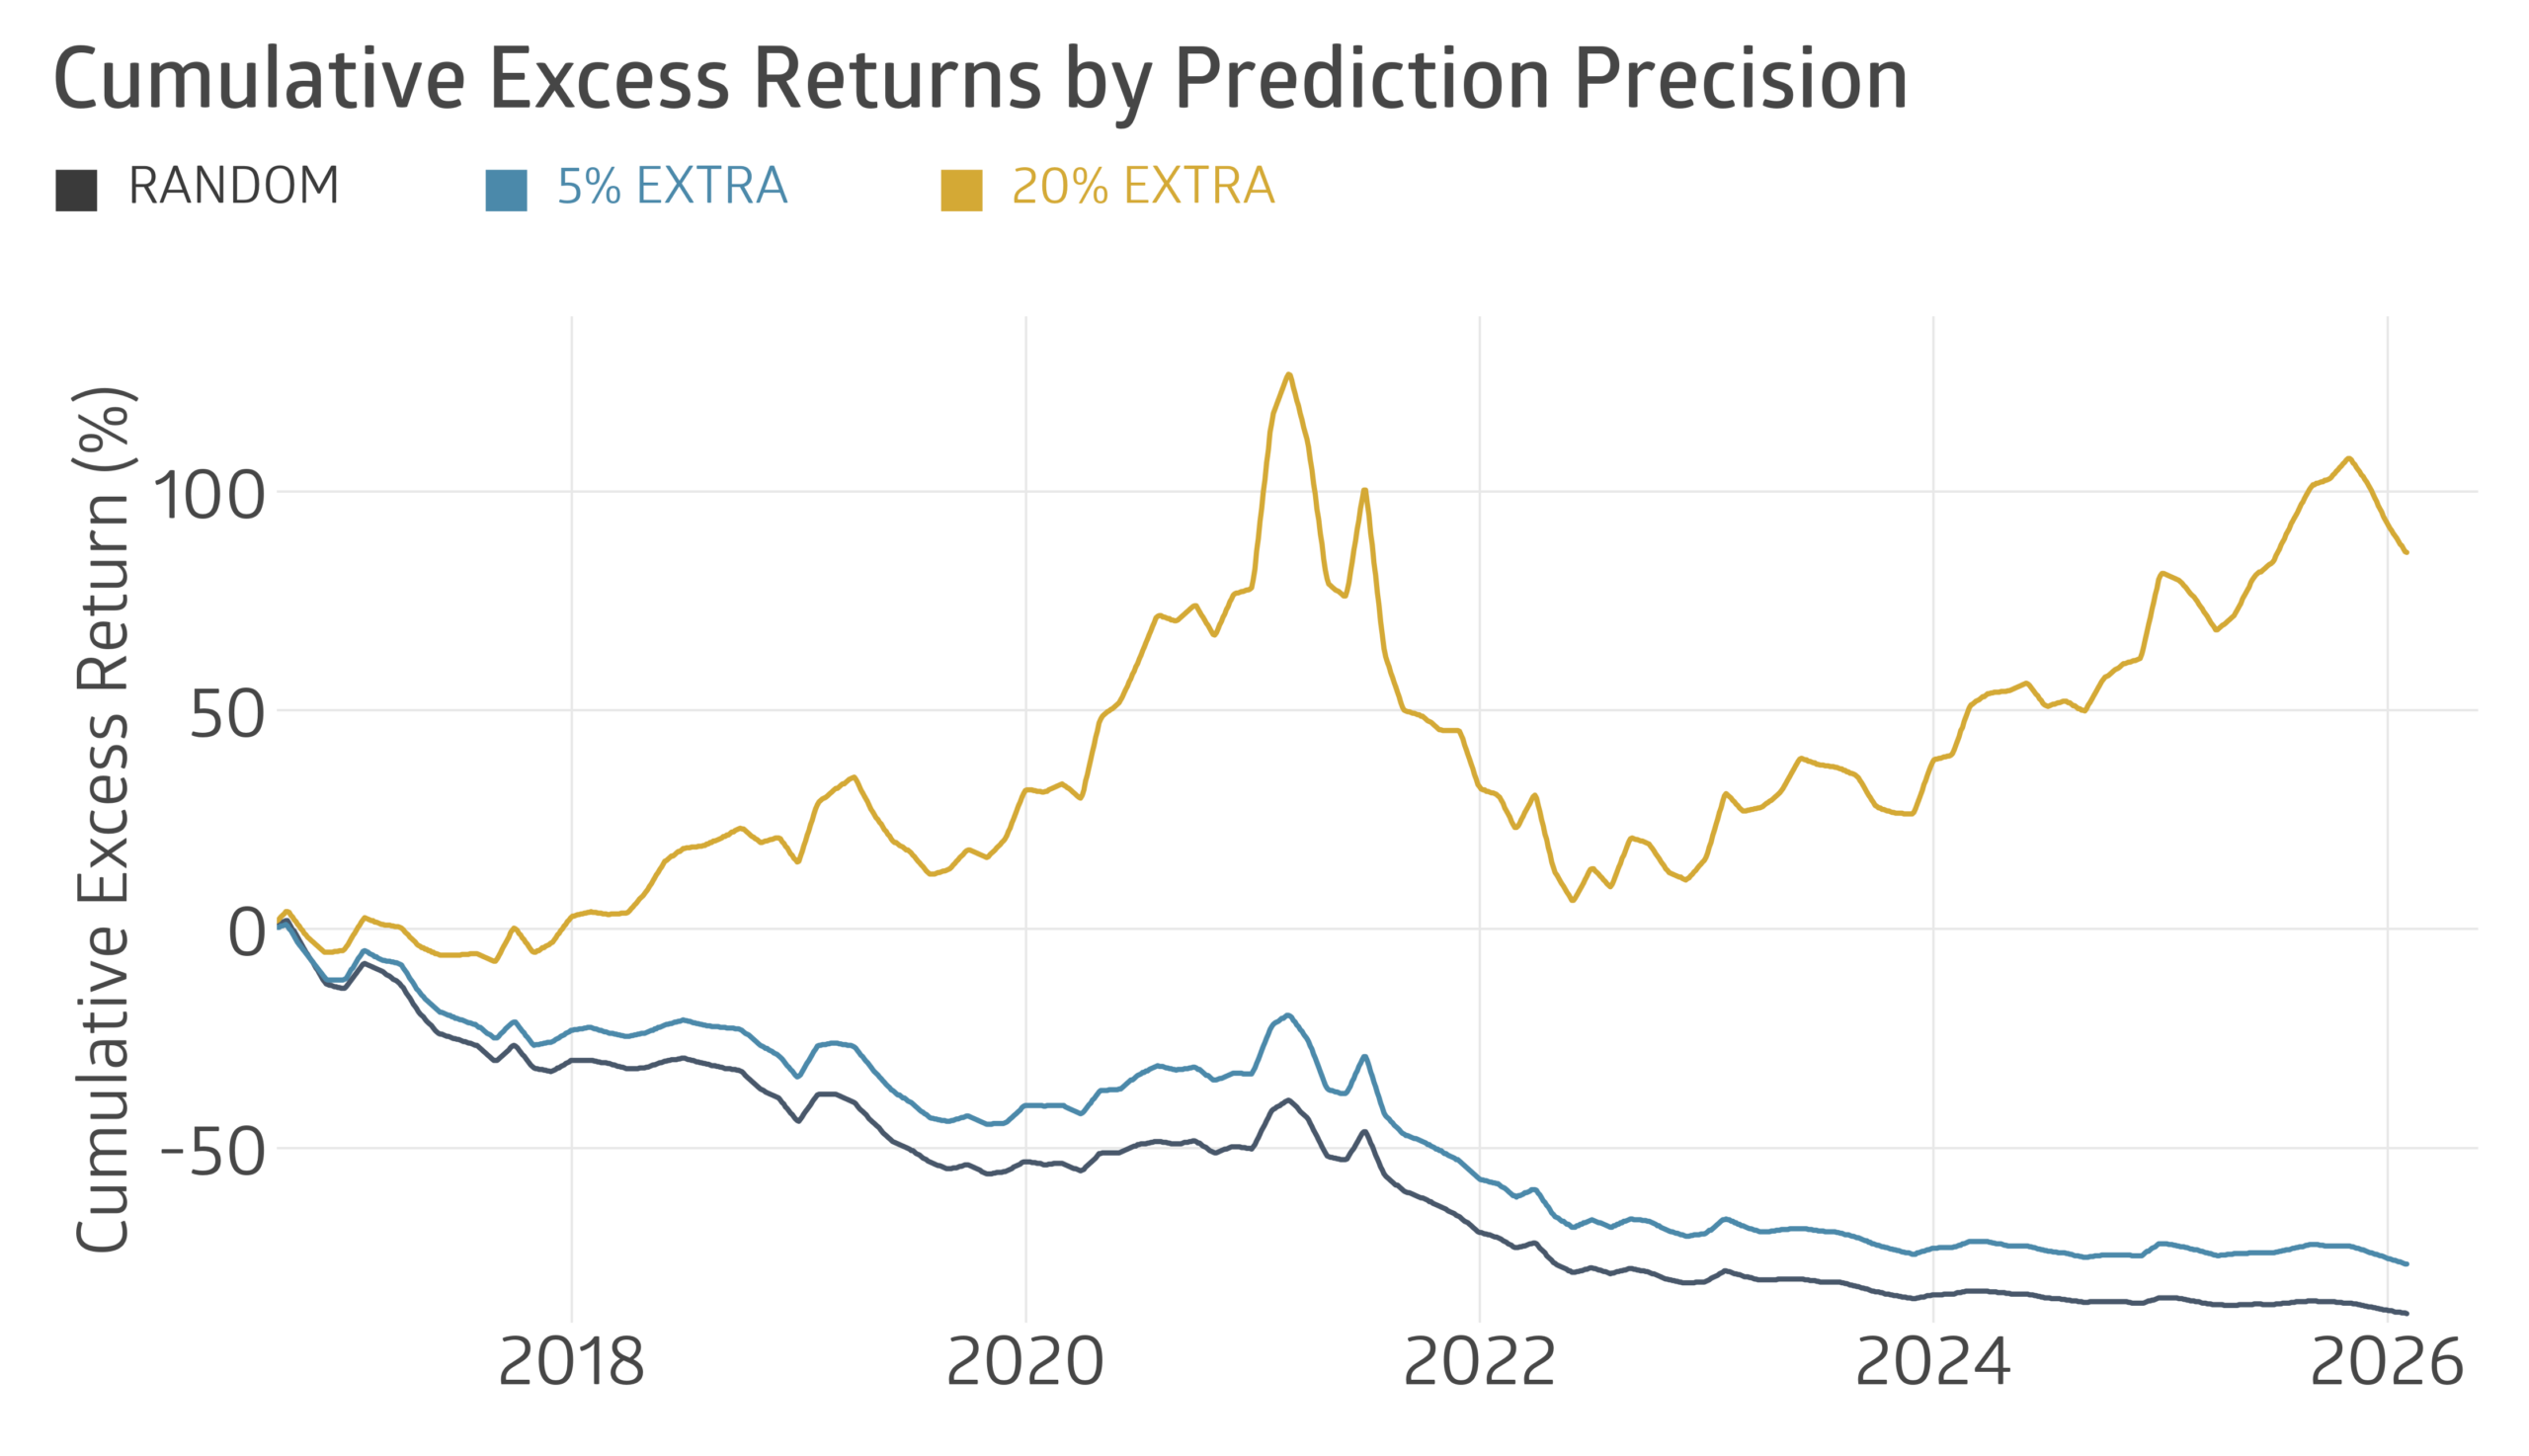
Our analysis simulated the universe of roughly 300 stocks at 36-month lows at any given time. The results are unambiguous: random selection from this pool produces consistent annualized losses. To simply break even, a manager needs to identify winners with approximately 20% greater precision than the random baseline. Even after testing a comprehensive set of public factors—management changes, earnings dynamics, sentiment signals, public interest—precision improves by only around 5 percentage points. The gap cannot be closed with harder work or better spreadsheets.
What follows is an explanation of why the turnaround narrative is so sticky, what the simulations reveal, and what a more durable small cap value alternative looks like.
The Allure of the Underdog
The turnaround story exploits two powerful forces simultaneously: the cognitive wiring of value investors, and a specifically American cultural appetite for comeback narratives.
Value investors are trained to distrust market sentiment. That discipline is generally an edge—but it creates specific blind spots in distressed situations. When a stock falls 60% from its peak, a quant screen lights up with apparently cheap multiples. What the screen doesn’t capture is that those multiples are anchored to a business that may no longer exist in the same form. Anchoring bias causes investors to fixate on historical metrics rather than reassessing from a clean slate; overconfidence bias leads them to trust their models over the qualitative signals—macroeconomic or interest rate pressures, changing buyer preferences, etc.—that the market is already pricing in.
The cultural layer compounds this. Research by Yalin Li and Min Zhao (2021) found that individuals in highly individualistic societies like the U.S. exhibit a significantly stronger need for uniqueness—a desire to deviate from consensus and champion the underdog. Backing a beaten-down stock is the financial equivalent of rooting for the underdog in a playoff series. When it works, the story is unforgettable. When it doesn’t, it gets quietly retired.
Fund managers know this. Few will explicitly advertise “catching falling knives,” but the language is recognizable once you know what to look for: a “contrarian” approach, stocks that are “special situations” or “out-of-favor” or where they believe there’s a “catalyst which has the potential to unlock value,” and heavy emphasis on “fundamental, research-oriented” process. The implication—that diligent research can overcome the informational challenge—is precisely what the simulations disprove.
Why the “Falling Knife” Stocks Story Persists
Prospect theory (Kahneman & Tversky, 1979) offers a precise explanation for why turnaround investing attracts capital even during periods of poor performance. When individuals are already experiencing losses, they become risk-seeking rather than risk-averse—especially when a large asymmetric payoff seems plausible.
A stock down 70% from its peak looks like a lottery ticket to a certain kind of investor. The downside—losing the remaining 30 cents on the dollar—feels almost beside the point when a 5x recovery is theoretically on the table. Prospect theory predicts that many investors will take this bet even when the expected value is negative. Across a broad population of similar distressed situations, that expected value is indeed negative—which is what our simulations confirm.
Survivorship bias reinforces the narrative. The turnaround successes get retold at conferences and in fund letters. Meanwhile, the stories of the many more distressed stocks that kept declining, went bankrupt, were delisted, or simply went dark, are not captured or shared as enthusiastically.
The Analysis: Simulating the Falling Knife
» Methodology
We simulated a universe of approximately 300 small cap stocks at 36-month lows at any given time—the genuine turnaround candidate pool. Running 100 simulations per scenario across 6-month forward horizons, we varied the manager’s assumed precision (incremental ability to identify winners above random chance) to determine the threshold for positive returns. In short: How much more accurate (than random) do managers need to be at identifying turnaround stocks to generate positive returns?
» The Baseline
Random selection from the 36-month-low universe produces consistent annualized losses over the 6-month horizon. The falling knife stocks, on average, keep falling. This is consistent with the momentum factor in the academic literature—recent underperformers tend to continue underperforming—but the simulation translates that finding into the operational reality facing a manager who has concentrated capital in exactly these situations.
» The Precision Gap
To generate flat returns before fees, a manager needs to be approximately 20% more precise than the random baseline at identifying turnaround stocks. To generate consistent alpha that justifies an active fee, the threshold is higher still. We then tested more than 100 publicly available factors –spanning, for example, management changes, earnings, sentiment, or public interest – to see which, if any, could close this precision gap.
The machine learning model, using these inputs, improved precision by approximately 5 percentage points—meaningful in a diversified factor framework, but 15 points short of the break-even threshold in a concentrated turnaround portfolio. The gap is structural, not a function of insufficient research effort.
 Sources: Bailard Research
The material risks and limitations of the simulation, including that actual market conditions and investment results may differ materially from those portrayed. These results do not represent actual performance, were not achieved by any investor or account, and actual results may vary substantially. Please see additional important disclosures about this simulation at the end of this document.
» What This Means for Manager Claims
A manager who claims consistent positive returns from concentrated turnaround positions is doing one of three things: experiencing statistical luck, operating with non-public information, or—most commonly—running a portfolio that is less concentrated in true turnaround situations than the marketing language suggests. This last dynamic, sometimes called style drift, is not necessarily a failing; it is a rational adaptation. But allocators deserve to evaluate it on its own terms, and consider alternative options better suited for their portfolio goals.
Analysis takeaway: Managers cannot reliably generate positive returns from concentrated turnaround portfolios because the precision gap is structural — even machine‑learning models and more than 100 public factors fall far short of the accuracy required to break even.
The Quantitative Small Cap Value Alternative
The value factor in small cap equities is real and well-documented. The problem with turnaround investing is not the pursuit of value—it is the pursuit of value in the most concentrated, momentum-challenged slice of the universe. Three structural adjustments produce a more durable approach:
- Systematic value across the full universe. Rather than concentrating in “out-of-favor” stocks or “special situations,” a diversified value portfolio harvests the premium across hundreds of positions. It requires only that the value factor continues to operate at the aggregate level—a considerably more defensible dependency than requiring each individual distressed bet to work.
- Momentum as a complement, not a contradiction. Positive earnings revisions, rising analyst estimates, and improving sentiment signals indicate that recovery is already visible in the data—not just in a thesis. A stock at a 36-month low with no positive momentum signals is precisely what the simulations show: a falling knife. The same stock three months later with two consecutive earnings beats has a materially different expected return profile.
- Breadth as the real edge. The full small cap universe contains 2,000–3,000 investable companies. A manager who accesses this opportunity set systematically, applies consistent factor criteria, and rebalances with discipline is operating with an edge that doesn’t require any individual bet to be right. This doesn’t generate dramatic “comeback” stories. It generates consistent, fee-justifying alpha over full market cycles.
Conclusion
The turnaround narrative is one of the most effective in finance because it is built on something true—markets can overshoot on the downside—and wrapped in language designed to resonate with exactly the kind of sophisticated, contrarian-minded investor it targets. But the empirical evidence is unambiguous: generating positive returns from concentrated positions in distressed small caps requires a precision that public information cannot deliver.
Managers who appear to overcome this constraint are, in nearly every case, either running a luckier-than-average book, quietly diversifying away from true turnaround positions, or both. The comeback story is more often a marketing strategy than a repeatable investment process.
The alternative is not exotic: systematic value exposure, momentum as a timing complement, and the breadth to let statistics do the work that narrative cannot. It is a harder story to tell at a dinner party. But it is a considerably easier track record to defend over a full market cycle.
Download the full PDF here.
About the simulated chart: The chart shows the average excess return of 100 simulations against the Russell 2000 benchmark. Simulations are run using portfolios of 20 stocks chosen from the Russell 2000 Value Index. To qualify, a stock had to be trading at its 36-month low. Portfolios are rebalanced every six months using different levels of predictive accuracy, called “precision” in the chart. In statistics, precision is simply True Positives / (True Positives + False Positives). It tells us how reliable the model is when it makes a positive prediction. Positive Class represents the stocks our model predicts will bounce back, or “revert. True positives are the stocks that actually bounce back. False positives are the ones that do not. A stock reverts if it lands in the top 40% of cumulative returns within its own subsector over the next six months. A 0% extra precision level means stocks are picked at random. Any percentage above that shows the model is using actual predictive skill.
The information in this publication is based primarily on data available as of June 30, 2026 and has been obtained from sources believed to be reliable, but its accuracy, completeness, and interpretation are not guaranteed. We do not think it should necessarily be relied on as a sole source of information and opinion.
This publication has been distributed for informational purposes only and is not a recommendation of, or an offer to sell or solicitation of an offer to buy any particular security, strategy, or investment product. It does not take into account the particular investment objectives, financial situations, or needs of individual clients. Neither Bailard nor any employee of Bailard can give tax or legal advice. The contents of this document should not be construed as, and should not be relied upon for, tax or legal advice. Any references to specific securities are included solely as general market commentary and were selected based on criteria unrelated to Bailard’s portfolio recommendations or the past performance of any security held in any Bailard account. All investments have risks, including the risks that they can lose money and that the market value will fluctuate as the stock and bond markets fluctuate. There is no guarantee that any investment strategy will achieve its objectives. Small and micro cap companies may face greater economic cycle risk, credit risk, geographic risk, product, and customer concentration risk than that faced by larger companies. Small cap and—to a greater extent—micro cap stocks are more volatile and less liquid than larger cap stocks and may be more difficult to trade. There are times when the small cap value equity style underperforms other equity investment styles. Past performance is no guarantee of future results. All investments have the risk of loss. This publication contains the current opinions of the authors and such opinions are subject to change without notice. Bailard cannot provide investment advice in any jurisdiction where it is prohibited from doing so. #NMREX
Recent Insights
Keep Informed
Get the latest News & Insights from the Bailard team delivered to your inbox.