

Morning Macro with Dave
Weekly perspective on current developments, emerging risks, and potential implications for investors.
Q2 Recap: Corporate Profits Remain a Tailwind
Dave Harrison Smith, CFA
Chief Investment Officer
September 24, 2026
Strength in corporate earnings has been an important support pillar for the U.S. equity rally in recent years. With the last of the off-cycle reporters now largely wrapped up, we can effectively close the book on the second quarter earnings season. By almost any measure, it was a stellar quarter.
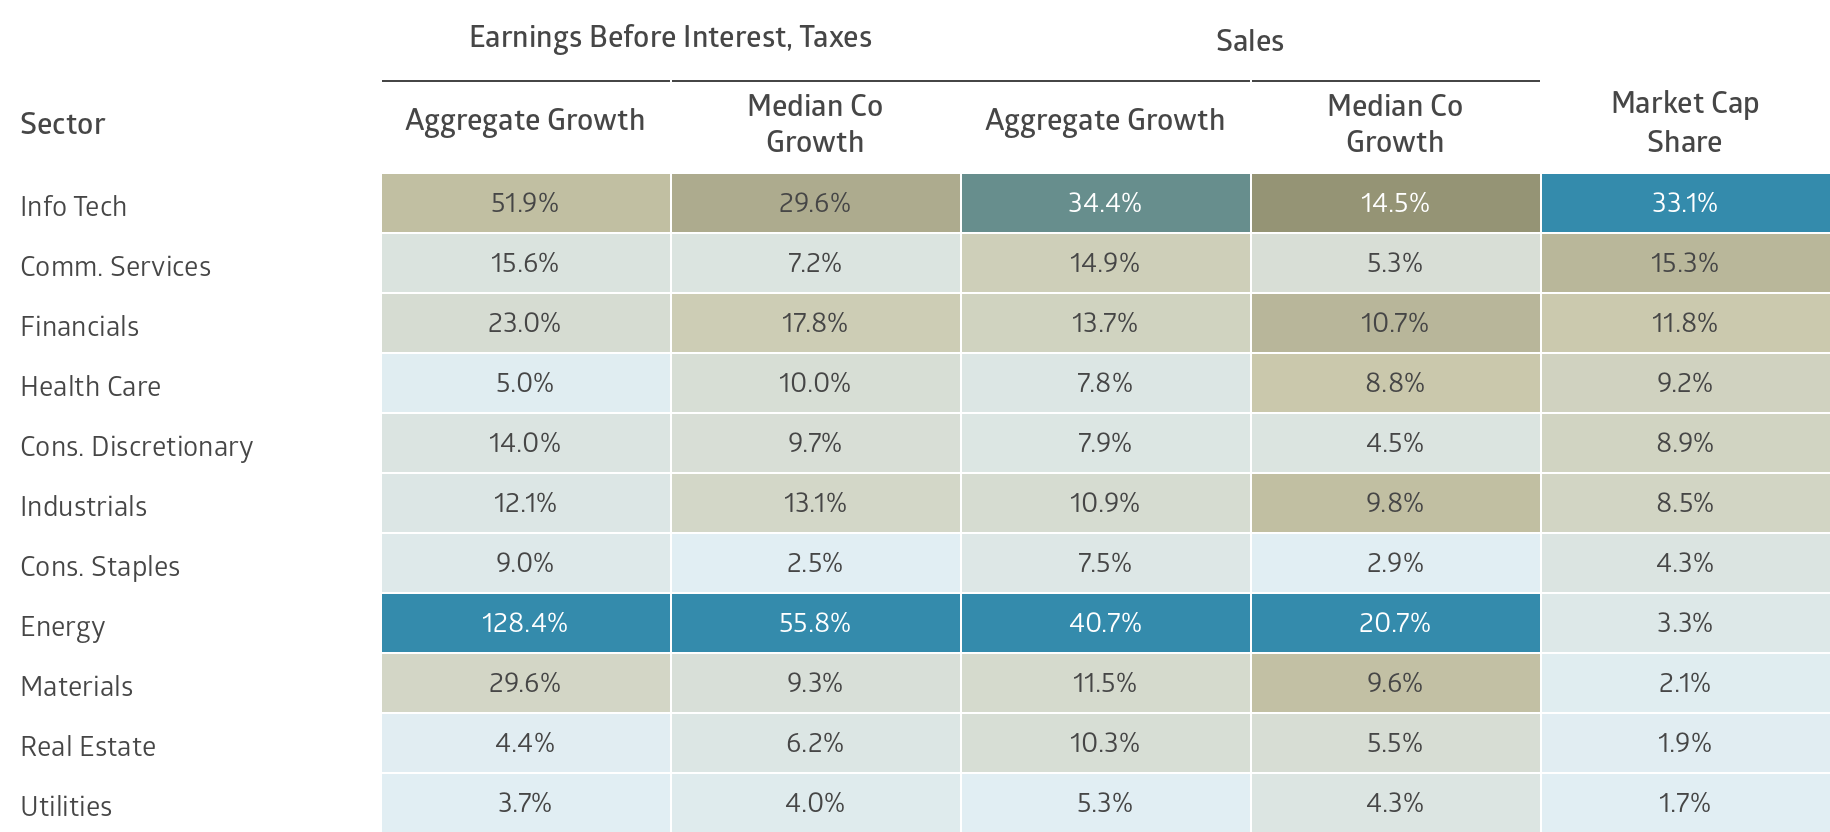
Aggregate operating income (EBIT) across the Russell 3000 index increased 28.2% versus the same quarter last year. That marks an acceleration from Q1 where aggregate OI grew just under 18%. This is an extremely impressive growth rate, with similar numbers rarely seen historically and almost exclusively occurring during rebound periods immediately following economic contractions. By sector, Energy and Information Technology stocks exhibited the strongest growth, with OI for Energy rising 128.4% over last year and Info Tech rising 51.9%. Utilities and Real Estate lagged at 3.7% and 4.4% growth, respectively.
Russell 3000 earnings before interest, taxes and sales by sector
 Source: Factset. Data as of 9/21/26.
Earnings growth remained top heavy with AI Infrastructure beneficiaries a major factor. Indeed, this should come as no surprise given the massive uptick in data center and AI infrastructure investment. However, this story obscures encouraging strength across other areas of the economy as earnings strength has broadened. In Q2, the median Russell 3000 company increased OI by an impressive 13.9%, an acceleration from 10.5% last quarter and up from an average of 9.3% over the preceding three quarters. Fully 71% of companies in the index exhibited positive OI growth for the quarter, further emphasizing the encouraging breadth of the earnings rally.
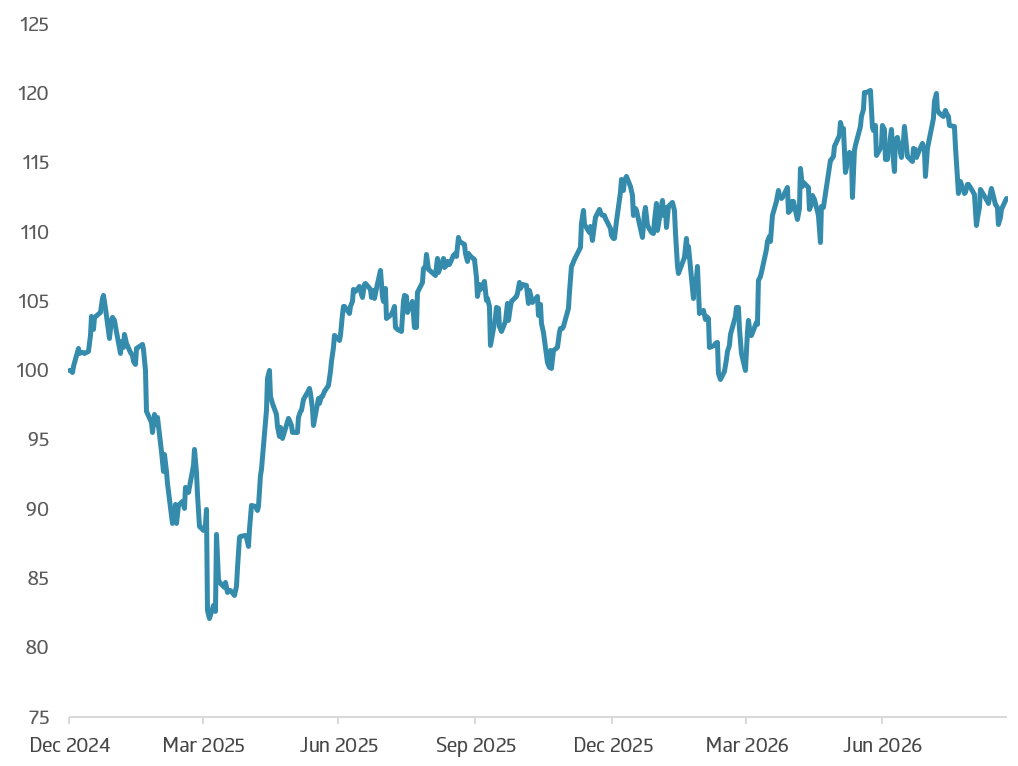
Cyclical businesses have been particularly strong. Operating income across cyclical sectors increased just over 33% from a year ago with forward estimates suggesting further strength over the coming quarters, helped in part by the resurgent energy sector. Defensive sectors also improved but to a lesser extent with growth remaining in the mid-single digit range. The relative performance of cyclicals versus defensive stocks has hardly moved in a straight line over the past two years, but the recent rebound in cyclical earnings is consistent with an economy that has proven stronger than many investors initially believed. Correspondingly, we have seen cyclicals move off of early year lows as this strength has become more clear.
Price performance of US cyclicals vs defensives
Source: Bloomberg, Goldman Sachs. Data from 12/31/2024-9/21/2026.
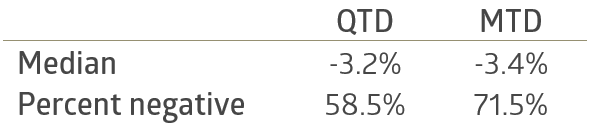
This fundamental earnings strength stands in sharp contrast with recent equity price moves. While large cap indices have shown resilience with the S&P 500 up +2.3% through September 18th, broader indices have struggled. The Russell 2000 index has falling -5.2% through the same period, with the median company in the Russell 3000 index down -3.3% quarter to date. 58.5% of companies have a negative return for the quarter and, more notable, 71.5% have a negative return month to date.
Russell 3000 median performance and percent of stocks declining
Source: Factset. Data as of 9/21/2026.
There are reasonable explanations for this divergence. Investors are contending with a higher probability of several emerging risks. The ongoing war in Iran, the steady drumbeat of rising interest rates, and the durability of AI spend amid several controversies are all weighing on sentiment. These concerns have not yet produced deterioration in corporate profits, but they have increased the risk that earnings strength may not be durable into the future.
The impact of these concerns is evident in several valuation ratios. The forward next twelve month price/earnings ratio for the S&P 500 has fallen to 19.0x, near the trough of the tariff shock last April. Semiconductor valuations have compressed even more sharply, with the Philadelphia Semiconductor Index trading in the 19x handle, down from 27.2x at the start of the year and more than 28% off of its three year average valuation.
The strength in corporate earnings remains a key support for equity prices. Recent stock market weakness has been driven more by valuation compression than deteriorating fundamentals. The trifecta of higher interest rates, simmering geopolitical risk, and the durability of AI investments can continue to damage sentiment and compress valuations. Yet, with earnings still growing strongly and with that growth becoming more broadly distributed, the fundamental backdrop for the equity market rally remains considerably more healthy than price action along would suggest.
# # #
Past performance is no indication of future results. All investments have the risk of loss.
The information in this publication is based primarily on data available as of its publication date and has been obtained from sources believed to be reliable. Still, its accuracy, completeness, and interpretation are not guaranteed. Bailard undertakes no duty to update any of the information contained herein, and such opinions are subject to change without notice. We do not think this publication should necessarily be relied upon as a sole source of information and opinion. This publication is not a recommendation of, or an offer to sell or solicitation of an offer to buy any particular security or investment product. It does not take into consideration the particular investment objectives, financial situations, or needs of individual clients.
Any indices or other financial benchmarks referenced are provided for illustrative purposes only. Indices are unmanaged, reflect reinvestment of income and dividends, and do not reflect the impact of advisory fees. Investors cannot invest directly in an index. Any individual securities referenced herein are for illustrative purposes only and not necessarily representative of investments that have been made or will be made in the future. Bailard, Inc. makes no recommendation to buy or sell securities discussed herein. Bailard clients may hold positions in the securities discussed and may buy or sell such securities at any time.
The S&P 500 Index measures large-cap U.S. equities; the Russell 1000 Index measures large-cap U.S. equities, with the Russell 1000 Growth and Russell 1000 Value indices measuring the growth and value segments, respectively; the Russell 2000 Index measures small-cap U.S. equities, with the Russell 2000 Growth and Russell 2000 Value indices measuring the growth and value segments, respectively; the S&P MicroCap Index and Russell Microcap Index measure micro-cap U.S. equities; the MSCI EAFE Index measures developed-market equities outside the U.S. and Canada; the MSCI Emerging Markets Index measures emerging-market equities; the Bloomberg U.S. Aggregate Bond Index measures the U.S. investment-grade taxable bond market; the Bloomberg U.S. Treasury Inflation-Linked Bond Index measures U.S. Treasury Inflation-Protected Securities, or TIPS; and the Bloomberg Municipal Bond Index measures the U.S. investment-grade tax-exempt municipal bond market. The U.S. CPI refers to the Consumer Price Index, a measure of inflation based on prices paid by consumers for a representative basket of goods and services.
Certain information may constitute “forward-looking statements,” which can be identified by the use of forward-looking terminology such as “may,” “will,” “should,” “expect,” “anticipate,” “project,” “estimate,” “intend,” “continue,” or “believe,” or the negatives thereof or other variations thereon or comparable terminology. Due to various risks and uncertainties, actual events, results, or actual performance may differ materially from those reflected or contemplated in such forward-looking statements.
Bailard, Inc. does not provide investment advice in jurisdictions where it is not authorized to do so.
Recent Insights
Keep Informed
Get the latest News & Insights from the Bailard team delivered to your inbox.