Linda M. Beck, CFA is a Senior Vice President of Bailard and Director of Fixed Income
March 31, 2019

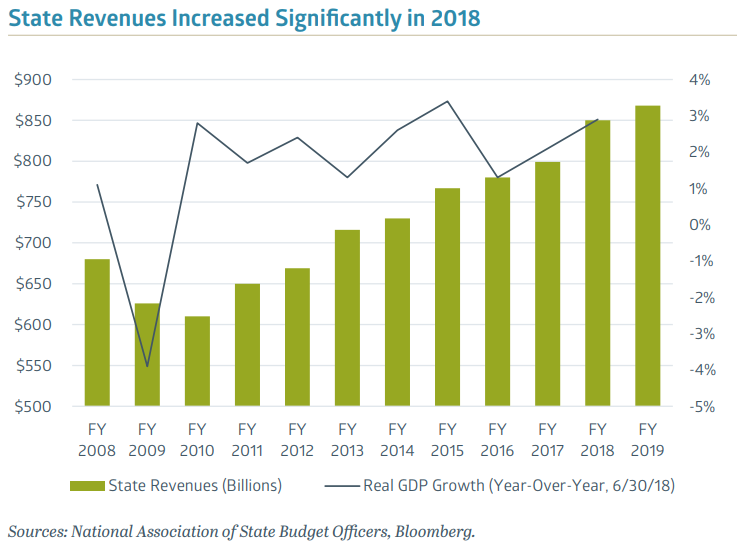
The U.S. economic recovery is on track to become the longest in post-WWII history. Real GDP has averaged 2.3% annual growth since this cycle started in mid-2009 after the GFC. In 2018, growth increased to 3.1%, bolstered by the Tax Cuts and Jobs Act (TCJA) of 2017. Importantly, economic growth serves as the foundation of credit conditions and quality.
State governments’ largest revenue sources (excluding intergovernmental transfers) are taxes: sales, income and corporate. For local governments, property taxes generate the most revenue. Positive economic growth usually results in high tax receipts, in turn supporting state and local governments. Realized gains or losses from the stock market can also have a significant impact on revenues.
Recovering from the GFC
State tax revenues have grown each year since the GFC, with growth slightly outpacing GDP. 2016 and 2017 had a weaker 1.7% to 2.4% range of revenue growth after the U.S. economy slowed in those years. Then in 2018, revenues surged to 6.4%, aided by the TCJA. The TCJA lowered marginal tax rates but incentivized taxpayers to realize taxes in 2018 that otherwise would have been realized in later years. Unlike the Federal government, most states must pass balanced budgets each year. When states experience revenue shortfalls, many often will implement mid-year budget reductions. In 2018, only seven states enacted such reductions: a reflection of the current strength, or credit health, of state governments.
In the current environment, there are more municipalities receiving credit rating upgrades than downgrades. As state governments began to recover from the financial impact of the GFC, the number of issuers receiving upgrades by bond-rating company Moody’s returned to healthier levels in 2014. However, the dollar amount associated with the upgrades was less than downgrades until 2016. This is the result of a small number of issuers with a large dollar amount of debt being downgraded in these years, including Puerto Rico, Illinois and the City of Chicago, among others. It was not until 2018 that upgrades finally exceeded downgrades in both number of issuers and dollar amount of debt.
Slower Growth Ahead
State general fund revenues are projected to grow 2.1% this fiscal year. In response, states have enacted modest budgets with some modest changes to their tax revenues sources, largely in response to changes stemming from the TCJA. Looking ahead, future global growth is expected to slow. The main impact of the TCJA—which boosted growth in 2018—is now behind us. Weakening demand from abroad, tightening financial conditions, geopolitical concerns, rising labor costs and pending tariffs are all expected to slow growth and add to the likelihood of a recession. Combined with actions at the state level, these policies will have mixed credit implications for a variety of business sectors, as well as for the credit quality of the U.S. and state and local governments.
Notably, more than half of states’ tax revenues fund education and health care. Many states face political pressure to increase spending in these areas, with many nationwide teacher strikes and mounting demand for increased funding as a result. Other spending may be reduced to offset these funding needs.
Implications Moving Forward
If the U.S. economy slows, this will most likely translate into less tax revenues to support municipal credits. States with the strongest demographic and migration trends will have more sustainable revenue growth. Whereas those with weak demographic trends and underfunded pension liabilities may struggle. With low interest rates, many governments and businesses have assumed additional debt; however, most state and local governments have low leverage levels, averaging only about 16% of GDP.

Most state and local governments have high exposure to equity market volatility through their pension funds. The condition of the State of California’s pension funding is similar to the national average: it is ranked 26th for underfunding. About 70% of California’s public pension liabilities are funded with existing assets. Since the GFC, public pension funds have reduced their projected investment returns, which has reduced the amount of liabilities funded. Fortunately, investment returns have been above those targets of late (although discount rates have been lower as well). Except for a few cases—including Kentucky, New Jersey and Illinois—most pension concerns represent long-term financial issues rather than a near-term cash crunch. Retirement health care liabilities are also a burgeoning liability for municipalities; however, unlike pension promises, these are generally not backed by explicit state guarantees, so most states and local municipalities are free to change the provisions of these plans or eliminate them entirely.
During recessions, tax revenues fall faster than wages and business profits because lower wages and profits push people into lower tax brackets. This means that after-tax incomes decline by less than pre-tax incomes, mitigating the harm to purchasing power caused by the recession. This has a stabilizing impact on the economy but makes state revenue sources more volatile. A significant stock market correction would also cause stress on state budgets.
Fortunately, since the last recession, states have been replenishing their reserves, which will provide a cushion in the next downturn. The median rainy day fund balance as a percent of general fund spending is about 7.3% this fiscal year, up from a low of 1.6% in 2010. California is one of the many states that created a rainy day fund after the GFC. With these reserves, states are expected to be able to successfully weather a short-term, moderate economic downturn. A more significant downturn, or a protracted one, would require additional spending cuts by states.
Recent Insights
Keep Informed
Get the latest News & Insights from the Bailard team delivered to your inbox.