Eric P. Leve, CFA, Executive Vice President and Chief Investment Officer
March 31, 2021
This is a story of evolution or, in some cases, the lack thereof. Our tale will begin in 1997, the earliest consistent global data, and will carry us through the present. We’ll examine how countries and sectors increased or waned in importance over the course of those 24 years, and we’ll look at where markets stand today and assess relative opportunities around the world given today’s economic and financial situation.(1)
By any measure, the road has been a bumpy one. By 1997, the markets were in the midst of what Alan Greenspan (then Federal Reserve Chairman) described as “irrational exuberance.” In reality, it was just the early stages of what we’d later coin the dot-com era, a bubble that wouldn’t burst until March of 2000. During that run-up we saw the value of the U.S. equity market rise relative to the rest of the world, mostly on the back of a technology stock explosion due to price appreciation and a robust IPO market. Through the ensuing 20 years we have seen periods of non-U.S. equities growing relative to their domestic peers—especially in the period leading up to the Global Financial Crisis (“GFC”)—but we have seen the opposite as well.
The traditional siren song of international equity true believers has always been: “As the rest of the world becomes wealthier and manufacturing moves overseas, these markets, especially emerging ones, will become a bigger piece of the global equity pie at the expense of the U.S.” The fact that this hasn’t yet come to fruition doesn’t necessarily mean it isn’t true. What does beg a thoughtful response is the data reflecting that U.S. equities rose from less than 47% of the global total in 1997 to more than 57% today (Exhibit 1).
The description of this evolution is threefold and having to do with: 1) a vibrant U.S. technology sector; 2) a somewhat unexpected evolution in the emerging markets (“EM”) space; and 3) challenges for developed markets, most notably in Europe.
 Dominance of Tech and Tech Giants
On the first point, mega-cap U.S. technology companies propelled much of the increase in U.S. exposure over this period. If we were to look at a version of Exhibit 1 excluding technology, the picture would be downright uninteresting: the U.S. ended the period exactly where it started, representing just under 41% of global equities. Further, U.S. dominance isn’t in proliferation of technology and technology-adjacent (TECH+) companies. That prize goes to China, which began the period lacking any technology stocks worthy of inclusion in MSCI to today where there are 108 TECH+ (2) companies in the index. Where America rises above the rest is in creating technology behemoths (Exhibit 2).

Emerging Markets Underwhelmed
Over the history we’re examining, Asia is the only region that increased its equity stake in the world. In fact, only four countries across the emerging markets space saw their share grow by more than 0.5%: China, Taiwan, South Korea, and India. As a whole, emerging markets more than doubled their share of the global equity pie, rising from 6.1% of global equities at the beginning of this period to 13.5% at the end. There is a large caveat, however; over 70% of that increase was due solely to China’s growth and its admittance to standard market indices. This final point is a critical one. Unlike most stocks that are typically reflected in MSCI’s indices based on their market capitalization, Chinese shares generally continue to get an 80% discount due to issues around market accessibility (e.g., the lack of derivatives on many Mainland stocks) and the too-short period between trade date and settlement date. While the Chinese market has vaulted from the third smallest equity market to the third largest over this study period, the real size of the market would give it a weighting twice that of Japan, the second largest market behind the U.S.
The story parallel with this regional shift in emerging markets is the dramatic change in sector exposures. A quarter century ago, EM investors were buying a lot of raw materials for export, banks to support local finance, utilities, and old-line telecommunications companies that provided phone service. Today, they are buying companies that represent the future of the world’s economy, as shown by the right-hand axis on Exhibit 3. Emerging markets used to be the area investors looked for basic materials; today it is the place to look for companies at the cutting edge of technology.
The chart also reflects another dramatic swing. Exhibit 3 begins with a near-equilibrium of exposures to the three broad regions of emerging markets: Asia, Latin America, and EMEA (Europe/Middle East/Africa). Over the next two decades, that balance tilted heavily to Asia, greatly minimizing Latin America and EMEA. And so, Asia’s strengths came to define the emerging markets.
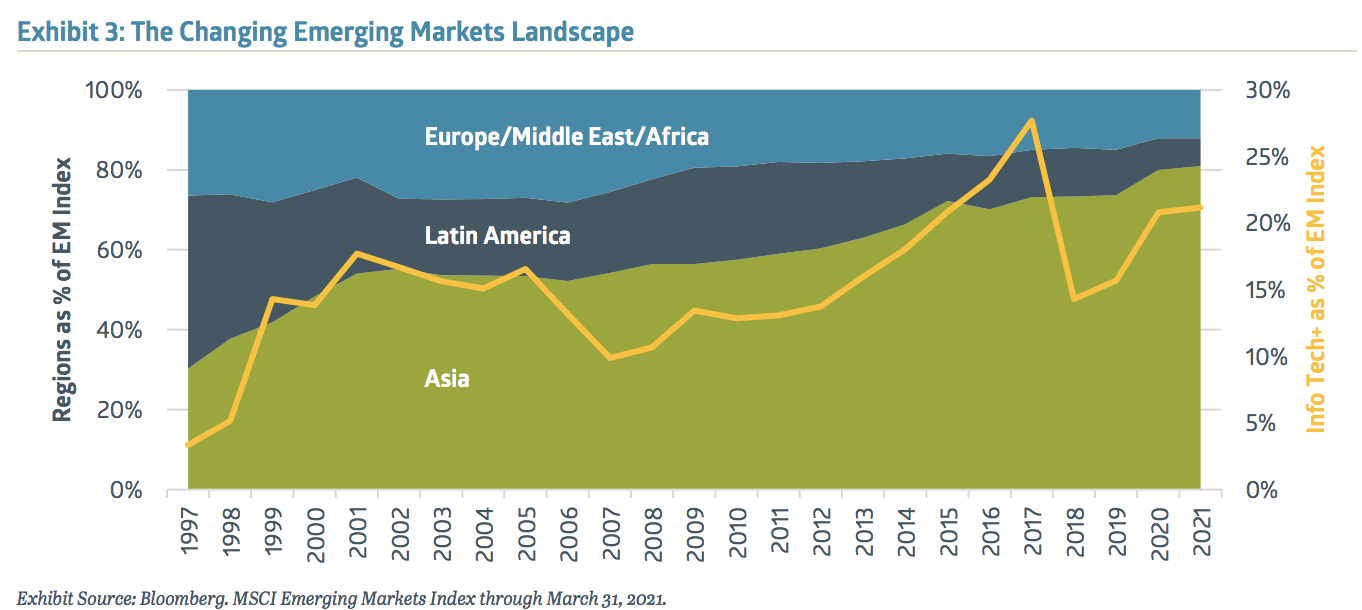
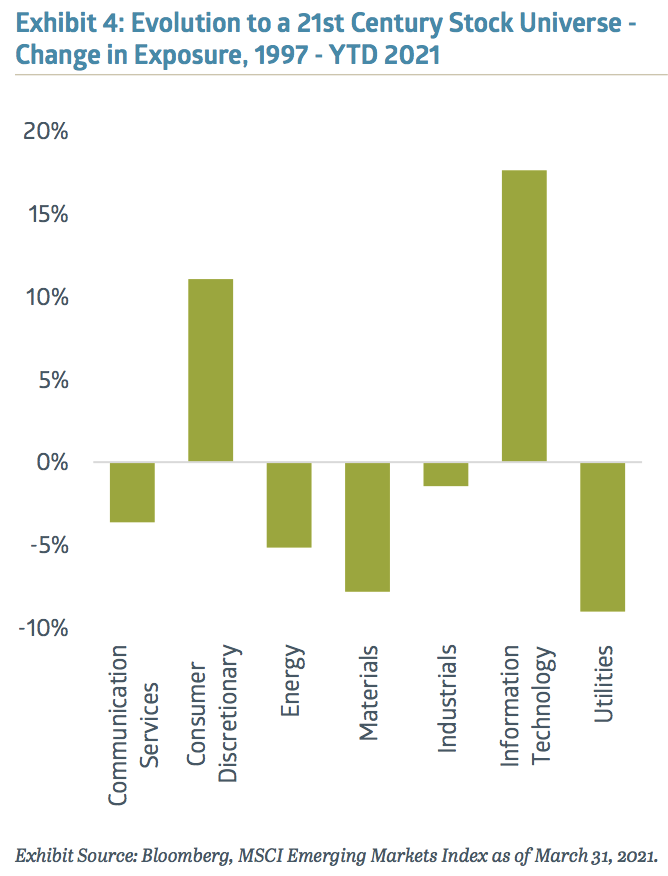 Exhibit 4 digs deeper at this evolution. Communication Services’ 4% decline over the period hides the interim reality that the space shrunk by more than twice that through 2017, as old-line telecom became a much smaller piece of the economic pie. The resurgence of the sector was based on the growth of next-gen EM communications companies such as Tencent and Baidu. Consumer Discretionary’s rise is similarly a story of sector evolution. Previously dominated by auto companies and old-line retail, it is now led by cutting edge e-commerce companies from around the globe. Finally, what stands out most is the dramatic rise in Info Tech paired with the sharp declines in Energy, Materials, and Utility stocks, making the emerging market space look increasingly like exposures in the U.S. stock universe.
Challenges in Europe
The developed markets story is one dominated by Europe. The formation of the European Union (“EU”) occurred in 1993 followed by the introduction of the euro as its currency in 1999. Since that time, the region has experienced what could generously be described as teething pains. And the fragility of a body with unified monetary policy but independent fiscal policy and disperse power wasn’t readily apparent until the GFC. The ensuing decade-plus pushed this system to its limits, leading to a Greek debt default in 2015 and the Brexit vote in 2016. Only last fall did the EU accept the long overdue reality that without some coordinated fiscal policy, the noble experiment was doomed.
The impact of these two lost decades for investors is profound. Over this period, these developed markets (Europe, Australasia, and the Far East or “EAFE”) dropped from just under 45% of global equities to 26%. U.S. tech, the rise of EM Asia, and Europe’s “own goal” drove this decline.
From Today’s Vantage Point
There are two positives for the EAFE markets, and Europe in particular. Europe’s move toward a fiscal union is the tough choice that has attractive potential to make the region become a world leader again. And Europe’s current mix of companies and sectors is very well-suited to capturing accelerating global economic growth. Relative to the U.S., this group has much higher exposures to Industrials, Materials, and Financials. Between what appears to be a global V-shaped economic recovery (with a lag in Europe due to a poor COVID-19 vaccine roll-out) and the push by the U.S., European, and Chinese leaders for massive infrastructure programs, these sectors may enjoy the kind of boom we saw in the mid-2000s when a commodities super-cycle led strong gains throughout the non-U.S. equity space.
As we exit from the COVID-19 year, markets are different in valuation, make-up, and opportunity as well as perception. On top of this, emerging markets continue to be places where burgeoning middle classes drive strong economic growth and the creation of innovative companies. Among developed markets, Europe remains a center for great engineering and production of next-generation industrial goods. Together, these undercurrents of non-U.S. equities could be the market leaders through the next investment cycle.
1 For the purposes of this article, the investment universe we are considering in all cases is the MSCI All Country World Index, which includes 85% of the capitalization of all markets considered by MSCI to be either Developed or Emerging.
2 TECH+ in the case of China is defined as the Information Technology sector plus Tencent, Alibaba, and Baidu; this narrow definition understates the real size of the space.
Recent Insights
Keep Informed
Get the latest News & Insights from the Bailard team delivered to your inbox.