Jeremy Wager-Smith, Fixed Income Portfolio Associate, examines the dynamic shifts and key trends that shaped the bond market in 2023.
A Dynamic Year
Interest rate volatility defined 2023 for fixed income markets. Markets skewed more reactionary than anticipatory, as the bond market digested a stronger-than-expected U.S. economy, an active Federal Reserve (Fed), regional bank turmoil, and a mountain of U.S. Treasury issuance.
The higher-for-longer interest rate narrative took hold by mid-year, as initial expectations of summer rate cuts faded, and a resilient U.S. labor market came into focus. Fed Chair Jerome Powell made clear the Fed’s commitment to bring inflation down to its 2% target as the Federal Open Market Committee (FOMC) elected to raise the Fed Funds target rate four times throughout the year, with the last hike occurring in July. This marked the eleventh interest rate hike of this cycle and brought the Fed Funds target rate to 5.50%, a level not seen since 2001. As expected, ultra-short yields rose in response to continued hikes and the Fed’s hawkish talk. 10-year U.S. Treasury bond yields peaked a bit later in mid-October at 4.99%—a level not seen since July of 2007—before dropping back down to close the year nearly unchanged. Looking forward to 2024, our outlook for bonds remains positive. We expect interest rate volatility to remain high, but at a more subdued level than in 2023.
A Look Ahead at Federal Reserve & Monetary Policy
In our view, markets are pricing in an excessive number of rate cuts in 2024 and, thus, a more dovish Fed than we anticipate. CME Fed Funds futures (a series of derivatives used to hedge short-term interest rates) are pricing in a 2024-year-end effective Fed Funds rate of 3.75%. This level implies over 150 basis points of rate cuts by year-end, with cuts beginning in March and continuing throughout the year.
Absent a recession or deflationary shock, we expect rate cuts to begin later in the year, and, cumulatively, to be fewer than what markets are pricing in. With the blistering rally in intermediate- to longer-dated Treasuries through year-end, markets have partially eased financial conditions for the Fed. The Goldman Sachs Financial Conditions Index—which uses borrowing costs, equity ratios, and credit spreads to gauge financial tightness—concluded 2023 at its lowest year-to-date level after reaching a year-to-date peak in late October.
Meanwhile, headline inflation is continuing its choppy decline from last year’s decade high of 9.1% and, as seen in December’s seasonally-adjusted unemployment rate of 3.7%, the U.S. labor market remains resilient. This still-strong U.S. economic picture and favorable financial environment, coupled with the Fed’s tendency to do too little too late, suggests that broad-based financial distress would need to accelerate dramatically to warrant the significant easing of monetary policy expected by markets in 2024.
Yield Curve Inversion Continues
The yield curve remains inverted, but to a lesser degree than a year ago. Often cited as a harbinger of economic pain to come, yield curve inversion occurs when shorter-term U.S. Treasury bonds outyield longer-term U.S. Treasury bonds. The most widely adopted measure of yield curve inversion is the spread, or difference in yield, between 10-year and 2-year U.S. Treasury bonds. This spread closed 2023 at -37 basis points, after beginning the year at a wider level of -56 basis points. With our expectation that the Fed will begin to cut the Fed Funds rate by mid-year, we anticipate this spread narrowing throughout the year as the short end of the yield curve retreats.
Municipal Credit Expectations
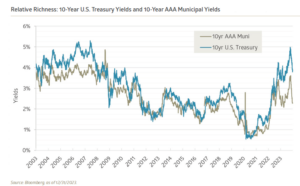
Municipal bonds rebounded in 2023 after a difficult 2022, as the Bloomberg 1-15 Year Municipal Bond Index saw a healthy uptick of 5.26%. Strong demand coupled with slightly lower municipal issuance on a year-over-year basis contributed to municipals ending 2023 at their richest levels in 40 years relative to Treasury bonds.
The credit profile of many municipal issuers experienced significant tailwinds coming out of the pandemic. Propelled by strong tax receipts and ample federal assistance, municipalities bolstered their balance sheets and established rainy-day funds. Since then, the combination of higher debt-servicing costs, rising operating expenses, and markedly weaker-than-expected tax revenues will most likely result in weaker municipal credit conditions in 2024. To insulate portfolios from much of this expected deterioration, taxable investors could stand to gain by favoring higher quality credits and resilient revenue sources.
We continue to closely monitor the State of California’s fiscal situation. A wealth exodus and absence of federal pandemic stimulus, combined with an overreliance on cyclical personal income tax revenues and optimistic revenue forecasts, have left the state facing budget deficits for fiscal years 2023 and 2024. Although the state does face fiscal difficulties, with its AA2/AA- rating we remain comfortable holding the state credit. In our view, demand for all California in-state bonds should remain high as state tax rates create demand for double-tax exempt income.

The Trajectory of Corporate Bonds
Aggregate and corporate bond indices provided positive returns in 2023, with the Bloomberg U.S. Aggregate Bond Index increasing 5.53% and the ICE Bank of America 1-10 Year Corporate Bond Index posting a 7.33% gain. Investment grade corporate spreads, or the pickup in yield between a corporate bond and a comparable maturity US Treasury bond, narrowed in 2023. If a hard economic landing or recession can be avoided, we anticipate spreads for high quality bonds staying relatively tight and rangebound throughout the year even with an expected increase in 2024 investment grade issuance.
Regarding industry-specific expectations, we continue to steer clear of regional banks due to ongoing concerns about the impact of held-to-maturity securities on their balance sheets. Instead, we prefer larger, systemically important financial institutions. For tax exempt investors, we have a continued preference for a higher allocation in corporate and mortgage-backed securities relative to standard aggregate benchmarks. We believe that the current, attractive level of interest rates offers a buffer against possible weakness in the stock market.
1 Bloomberg – FFG4 COMB Comdty
2 Bureau of Labor Statistics
3 Yield Curve – Plotted series US Treasury bond yields. Organized from shortest to longest time to maturity.
4 Bloomberg
5 Bloomberg YTDMTOT Index
6 “S&P Downgrades California Bond Outlook Amid Budget Crunch” – The Center Square
7 Investment Grade – Corporate bonds rated Ba1/BB+ or higher
Recent Insights
Keep Informed
Get the latest News & Insights from the Bailard team delivered to your inbox.