Jamil Harkness, Research and Performance Associate, explains how investing wisely in private real estate requires patience, prudence, and a focus on fundamentals rather than market timing.
Commercial real estate (CRE), once an easy and upward path, has become more treacherous. This highly favorable period from Q1 2010 to Q2 2022—when the National Council of Real Estate Investment Fiduciaries (“NCREIF”) Open-End Diversified Core Equity Real Estate Index (“NFI-ODCE”) enjoyed an extraordinary streak of favorable positive performance in 49 of the 50 quarters—is now in the rear-view mirror. This “Goldilocks” era for real estate was driven by steady economic growth; providing a stable base for favorable real estate fundamentals, historically accommodative capital markets with abundant and inexpensive debt and equity supporting a robust transaction market, and unprecedented yield rate compression pushing values up.
Starting March 17, 2022, real estate hit a rough patch when the Federal Reserve (the “Fed”) embarked on its most aggressive interest rate-raising cycle in four decades, aimed at slowing the economy and staunching runaway inflation. Over the past ~18 months the Fed has hiked rates eleven times (from 0% to 5.5%), yet the economy has continued to grow, consumers have continued to spend, and businesses have continued to hire. Private real estate, on the other hand, reacted quickly to the Fed’s actions. Interest rates are now at pre-Great Financial Crisis (“GFC”) levels, and values for the four major property types have fallen by approximately 12.3%, on average (Q3 2022 through Q2 2023, as reported by NFI-ODCE).
 Though Q3 2023 returns for the NFI-ODCE won’t be finalized until the end of October, the Bailard Real Estate team believes it is likely that the Index will register its fifth straight quarterly decline. This is the longest string of negative performance since Q3 2008 to Q4 2009.Amid this five-quarter pullback, and with little prospect that the Fed will ease rates any time soon, the entire industry (investors, lenders, intermediaries, service providers, and others) is wondering when real estate values will hit bottom. Predicting any market bottom is, as they say, a “fool’s errand.” We will know it only after it has actually registered its low point. This time will be no different. There are, however, some markers that may help illuminate where the market stands and when a bottom might be forming.
Fundamentals and Capital Markets
The current real estate recession has been driven substantially by capital markets factors. Unlike previous real estate downturns, three property types—multifamily, industrial, and retail—have maintained mostly solid fundamentals. Despite localized oversupply (e.g., industrial in Dallas, Denver, and San Jose… and multifamily in Atlanta, San Antonio, and Phoenix) pushing vacancies up and rents down, there has not been any widespread overbuilding that characterized previous downturns in the early 90s, early 2000s, and from 2005 to 2007 leading up to the GFC. As a result, these property types, while negatively impacted by the capital market’s effects, have so far experienced relatively modest value declines. Office properties are a different story. Fundamentals are abysmal, investor sentiment is in the tank, and return requirements have “blown out.” Much of the sector is priced as if the property type is permanently impaired.
The Impact of Interest Rates
The 10-year U.S. Treasury rate serves as a key metric for two primary reasons. First, because most CRE investors view the asset class as a “long-term” hold, benchmarking against a longer-dated “risk-free” bond has been a traditional way to properly fit property pricing into a risk/return construct. Second, institutional lenders (i.e., banks and insurance companies) use 10-year Treasuries (and shorter-dated T-Bills) as the index to price 2, 5, 7, and 10-year mortgage loans. Since debt is the grease that keeps the real estate transaction machine running smoothly, the cost and availability of mortgage money is critical to a healthy and active investment market.
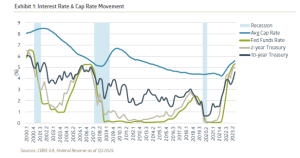
For most of the past 40 years, real estate capitalization rates1 have been between 100 and 300 basis points2 higher than the 10-year Treasury rate. During that period, it’s been as wide as 400 bps and as narrow as 0 bps. There are several reasons real estate has typically traded at a discount to a 10-year Treasury including illiquidity and risk. Exhibit 1 shows the interesting relationship between interest rates and cap rates over the 23-year period since 2000.
As of September 30, the Fed’s aggressive actions have pushed the 10-year Treasury to 4.59% (a jump of 161 basis points over the last 18 months), and the average cap rate for major asset types to 5.6% (an increase of 116 basis points over the same time span).3 The future direction of interest rates plays a pivotal role in shaping cap rate movement and CRE values.
Real Estate Mortgage Delinquencies
Surging mortgage delinquencies typically signal losses for banks, especially when property values dive below loan balances and/or property cash flows fail to cover debt service. Rising losses often cause lenders to alter their terms, including higher rates, lower proceeds, more stringent credit standards, and stricter covenants. These conditions amount to tighter lending standards and/or pull back entirely from the market, which limits options for borrowers and makes debt capital more difficult to obtain. Some of those bank losses become bank (or insurance company) “Real Estate Owned” (REO), and are spit out at fire sale prices exerting further downward pressure on values and negatively influencing investor sentiment.
Currently MSCI Real Capital Analytics projects that $566 billion of real estate-backed loans will mature by the end of 2025, necessitating refinancing in a challenging environment. This will likely inflate delinquency rates. Federal regulators have recently provided policy guidance to encourage lenders to work with borrowers to resolve impairments and potential delinquencies to limit damage and mitigate losses.
In Q2 2023, banks’ delinquent CRE loan balances escalated to $18.2 billion, marking a sharp 36% increase year-over-year. Consequently, delinquent CRE loans now account for 1.01% of total CRE loans.4 For comparison, CRE loan delinquencies hit 11.8% in Q2 1991, 1.9% in Q3 2001, 8.9% in Q1 2010, and 1.1% in Q4 2020. By historic standards, the rate of CRE delinquencies is still a pittance, but most market observers expect the numbers to rise as loans that were issued in the 2015 to 2020 timeframe mature over the next two years. Approximately 46% of banks have tightened their standards as of Q2 2023. Furthermore, average mortgage rates have jumped from 3.7% in early 2022 to 7.9% in Q2 2023.5
Public REIT Performance
The NAREIT Equity REIT Index, reflecting the performance of publicly traded REITs, can provide real-time insights into market sentiment and a snapshot of investors’ expectations. As such, activity in the public arena often acts as a leading indicator of private real estate.
Historical data supports this linkage. For instance, during the GFC, the NAREIT Equity REIT Index first reported negative returns in Q2 2007, followed by the NFI-ODCE reporting negative returns five quarters later in Q3 2008. Recently, history repeated itself: the NAREIT Index showed negative returns for three consecutive quarters starting in Q1 2022, and by Q4 2022, the NFI-ODCE followed suit. The Bailard real estate team believes that a positive turn in the public real estate market may foreshadow improving conditions for private real estate investors and owners.
Timing the Market
It’s important to remember that commercial real estate is a long-cycle asset, requiring prudence and patience. Trading strategies designed for the public markets aren’t generally suited for private real estate investment. The go-go days from 2010 through 2022, with markets awash in cheap and plentiful debt capital, were unusual and allowed market timers to harvest quick gains like house-flippers in the mid-2000s. This was all fueled by the Fed’s easy-money policies. That era is in the rear-view mirror and the current re-set is long overdue. It’s back to basics. Money will be made the old-fashioned way by emphasizing leasing and tenant satisfaction, reducing expenses, and carefully allocating capital to manage risk and maximize cash flow. For investors, it’s a return to focusing on the long-term and the inherent benefits of private real estate: income generation, inflation hedge, portfolio diversification with lower volatility and non-correlation with other asset classes, and potential for upside.
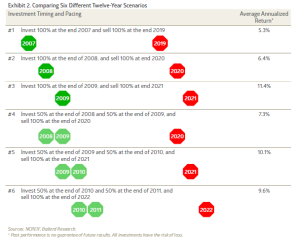
Exhibit 2 shows six different, twelve-year horizon investing scenarios with different timing and pacing, from 2007 to 2010. It’s instructive to see what the returns are for these very different approaches.
This analysis using annualized NFI-ODCE returns revealed that the highest return of 11.4% was achieved by investing fully at the end of 2009 and selling entirely by the end of 2021 (Scenario #3). This result confirms the general belief: investing after a market low allows for a prolonged period to capitalize on market upswings, yielding greater profits. Meanwhile, Scenarios #5 and #6 secured the next best returns at 10.1% and 9.6%. They benefited from strong returns in 2010, 2011, 2015, and 2021. In contrast, Scenarios #1, #2, and #4 garnered the lowest returns (5.3%, 6.4%, and 7.3%), encompassing the GFC’s downturns before recovery. Regardless, all scenarios delivered commendable low volatility returns.
Why It Matters?
Attempting to time a market bottom is a precarious endeavor, often leading to missed opportunities. While the allure of buying low and selling high is every investor’s dream, it’s impossible to do so with consistency due to the myriad unpredictable factors influencing performance. Instead, a more prudent approach is to invest somewhere near the bottom—that is, after a material market pull back—and then exercise patience. By doing so, investors can capture substantial gains during the recovery phase without the stress of trying to pick the bottom. By focusing on the long term and resisting the urge to market-time, investors can achieve solid and sustainable returns, underlining the adage that it’s not about timing the market but rather time in the market.
1 The capitalization rate (“cap rate”) is a measure of an asset’s income over its market value.
2 A basis point (“bp”) is 0.01%.
3 CBRE-EA & Federal Reserve Economic Data (FRED) 2023.
4 S&P Global Market Intelligence “Commercial real estate charge-offs at US banks surge YOY in Q2 2023″.
5 CBRE-EA Quarterly: The Full Picture September 2023.
Recent Insights
Keep Informed
Get the latest News & Insights from the Bailard team delivered to your inbox.