

Morning Macro with Dave
Weekly perspective on current developments, emerging risks, and potential implications for investors.
Strong quarters don’t usually end the rally
Dave Harrison Smith, CFA
Chief Investment Officer
July 8, 2026
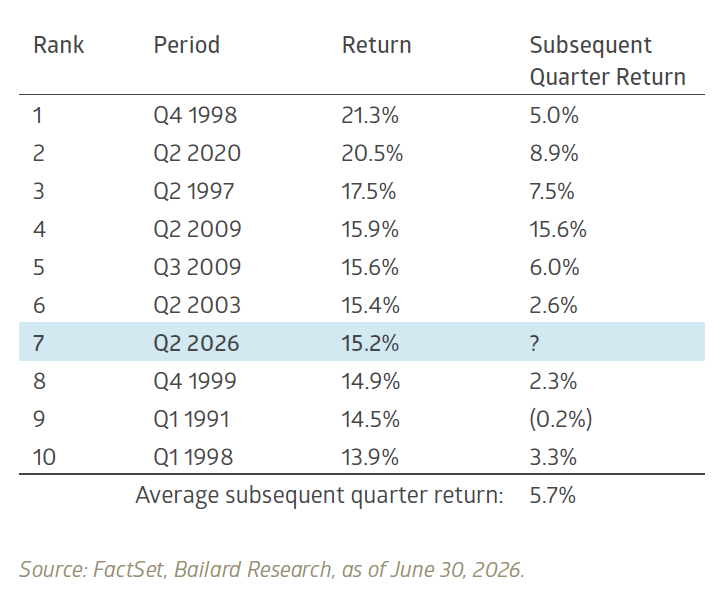
The second quarter was a historic one by several measures. The +15.2% total return for the S&P 500 Index was the strongest quarterly result since the pandemic-era rebound in Q2 2020 and ranked as the seventh-strongest quarter since 1988. The gain reflected both exceptionally strong corporate results and a powerful reversal in sentiment following a weaker Q1.
Exceptional performance naturally raises the question of whether the markets have come too far, too fast. Though the sample size is small and past performance is far from a guarantee, history does offer an encouraging picture: the strongest quarters have not historically marked the end of a rally or been followed by meaningful next-quarter weakness. Indeed, the S&P 500 continued to advance in eight of the nine other top quarters, with an average subsequent return of +5.7%.
Strong quarters have often been followed by additional gains
S&P 500 Index, quarterly returns, Jan 1988 – Jun 2026
Elsewhere in markets, the strength we saw in domestic large cap stocks extended across several other risk asset categories. Small cap equities posted particularly strong results for the quarter ending June 30, with the Russell 2000 Index returning 21.5% and outperforming the S&P 500 by 6.3%. This broad participation may partially reflect improving sentiment after the geopolitical and economic uncertainty of the first quarter, but it may also provide encouraging evidence of the underlying economic re-acceleration we have noted in recent weeks.
Q2 returns showed broad strength, led by small caps and international equities
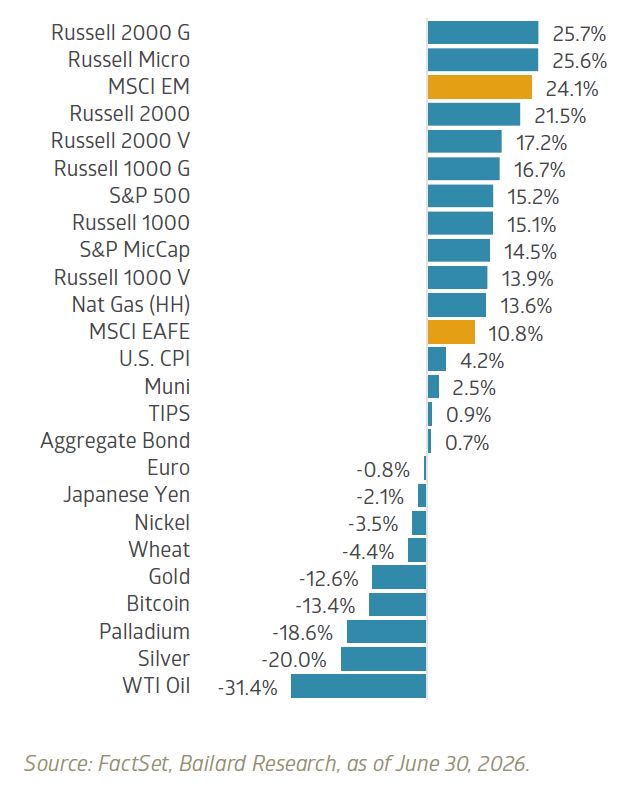
One of the most notable divergences during the quarter was the stark outperformance of the MSCI Emerging Markets (EM) and the MSCI EAFE Index, a widely used benchmark for developed international markets. This gap can be partially explained by the exceptional performance of tech-heavy emerging-market countries such as South Korea and Taiwan.
The stellar performance of these markets in little over a year has materially reshaped the EM Index. As of quarter-end, technology stocks accounted for 45.3% of the MSCI EM Index, with major tech hubs Taiwan and South Korea accounting for 51.1% of the Index. The Index has also become concentrated at an individual stock level, with semiconductor giants Taiwan Semiconductor, Samsung Electronics, and SK Hynix representing 15.1%, 8.2%, and 7.7% of the Index, respectively. This concentration, along with the strong quarter for technology stocks and the resurgent AI trade, helps explain much of the gap between emerging markets and developed-market peers.
The market’s return for the quarter was historic, and the breadth was encouraging. Yet the underlying composition of these returns remains an important consideration. As we enter the second half of the year, investors should remain focused on the broadening of economic growth and the durability of the economy’s strongest performing themes.
# # #
Past performance is no indication of future results. All investments have the risk of loss.
The information in this publication is based primarily on data available as of its publication date and has been obtained from sources believed to be reliable. Still, its accuracy, completeness, and interpretation are not guaranteed. Bailard undertakes no duty to update any of the information contained herein, and such opinions are subject to change without notice. We do not think this publication should necessarily be relied upon as a sole source of information and opinion. This publication is not a recommendation of, or an offer to sell or solicitation of an offer to buy any particular security or investment product. It does not take into consideration the particular investment objectives, financial situations, or needs of individual clients.
Any indices or other financial benchmarks referenced are provided for illustrative purposes only. Indices are unmanaged, reflect reinvestment of income and dividends, and do not reflect the impact of advisory fees. Investors cannot invest directly in an index. Any individual securities referenced herein are for illustrative purposes only and not necessarily representative of investments that have been made or will be made in the future. Bailard, Inc. makes no recommendation to buy or sell securities discussed herein. Bailard clients may hold positions in the securities discussed and may buy or sell such securities at any time.
The S&P 500 Index measures large-cap U.S. equities; the Russell 1000 Index measures large-cap U.S. equities, with the Russell 1000 Growth and Russell 1000 Value indices measuring the growth and value segments, respectively; the Russell 2000 Index measures small-cap U.S. equities, with the Russell 2000 Growth and Russell 2000 Value indices measuring the growth and value segments, respectively; the S&P MicroCap Index and Russell Microcap Index measure micro-cap U.S. equities; the MSCI EAFE Index measures developed-market equities outside the U.S. and Canada; the MSCI Emerging Markets Index measures emerging-market equities; the Bloomberg U.S. Aggregate Bond Index measures the U.S. investment-grade taxable bond market; the Bloomberg U.S. Treasury Inflation-Linked Bond Index measures U.S. Treasury Inflation-Protected Securities, or TIPS; and the Bloomberg Municipal Bond Index measures the U.S. investment-grade tax-exempt municipal bond market. The U.S. CPI refers to the Consumer Price Index, a measure of inflation based on prices paid by consumers for a representative basket of goods and services.
Certain information may constitute “forward-looking statements,” which can be identified by the use of forward-looking terminology such as “may,” “will,” “should,” “expect,” “anticipate,” “project,” “estimate,” “intend,” “continue,” or “believe,” or the negatives thereof or other variations thereon or comparable terminology. Due to various risks and uncertainties, actual events, results, or actual performance may differ materially from those reflected or contemplated in such forward-looking statements.
Bailard, Inc. does not provide investment advice in jurisdictions where it is not authorized to do so.
Recent Insights
Keep Informed
Get the latest News & Insights from the Bailard team delivered to your inbox.