Country Indices Flash Report – March 2021
Developed market equities were supported in March by a free-spending U.S. government, as $1.9 trillion in stimulus was followed by the prospect of an equally massive infrastructure plan. Industrials have been among the leading beneficiaries. Inflation fears and bond yields have also been stimulated along with the economy.

Looking for Income in a Low-Income World
Linda M. Beck, CFA, Senior Vice President and Director of Fixed Income
March 31, 2021
While interest rates have risen sharply off last summer’s lows, they remain historically low. 10-Year U.S. Treasury Bond rates moved from 0.50% in July 2020 to 1.74% at quarter-end. Although rates are back to pre-pandemic levels, they remain below longer-term historical averages: 10-Year Treasury rates averaged 2.3% since the 2007-2009 Great Financial Recession and a whopping 5.8% from 1990-2007.
Growth Outlook
The Federal Reserve (the Fed) has committed to keeping the Federal Funds rate low for several years to help the U.S. recover from COVID-induced shutdowns. Short-term interest rates are highly correlated to the Funds rate, so they should stay low. Intermediate and longer-dated rates are driven by expectations for economic growth and inflation. The surge in rates since last summer reflected investors’ improving economic outlook after the government’s massive fiscal stimulus and the Fed’s monetary ease.
The massive fiscal and monetary stimulus enacted to-date should lead to a surge in GDP and a pickup in inflation this year and into the next. Once this stimulus works its way through the system, we expect growth to return to the 2.0% to 2.5% pace of the past few decades. This slow rate of growth is consistent with our aging U.S. work force. Since longer-dated interest rates are driven by multi-year expectations of growth and inflation, and we expect the pace of growth to begin moderating sometime in 2022, we believe rates will grind only a bit higher from today’s levels rather than continue their recent spikes.
Foreign and Institutional Demand for U.S. Bonds
Strong demand for U.S. bonds will keep a lid on interest rates, which are higher than those in most other developed countries. 10-Year German Bunds yield a negative 0.30% while Japanese government bonds yield only 0.09%. With the large yield pick-up offered by U.S. bonds, foreign buyers have shown strong demand, despite massive supply.
Insurance companies and pension funds may become large buyers of bonds if 10-year rates move north of 2%. These funds have become over-weighted to stocks after equities’ strong appreciation, leaving them underweighted the bonds needed to match long-dated liabilities. We expect they will become aggressive buyers if rates rise much further from today’s levels.
Lastly, the Fed can redirect its purchases to longer-dated bonds, although it would only do so if rates were impeding economic growth or the market became disorderly. With such strong potential demand for our bonds, it seems unlikely that rates will return to the high levels experienced over 20 years ago.
Diversification Still Crucial
Although interest rates may stay historically low, bonds remain a critical component for investment portfolios. Besides providing a stable source of income, bonds also provide an important source of diversification as their prices typically move inversely to stock prices. Thus, in periods of stock market weakness, bonds often appreciate, reducing the deterioration in portfolios’ total value. With historically-rich valuations across many asset classes, this diversification is particularly important. Additionally, the same factors keeping a lid on interest rates could dampen returns in other asset categories, making the comparison to the low yields less stark.
Understanding Risk
Investors seeking a higher level of income than available in today’s investment grade bond market need to understand the risks imbedded in pursuing such strategies. In the stock market, higher yielding (dividend) stocks are often considered less risky, defensive strategies. High dividends are generally issued by staid, low growth companies, without much capital gain potential. For bonds, on the other hand, there is a known redemption and scheduled coupon payments, so higher yields reflect elevated risk.
There are many types of risk inherent in owning bonds, including: interest rate, credit, structure, liquidity, and correlation to the stock market. One should understand which risks one is assuming when purchasing high income strategies and be aware of how they may impact total portfolio return potential.
Some higher income vehicles are sector hybrids and come with the higher volatility of stocks, such as preferred stocks and master limited partnerships. Closed-end funds offer more income through leverage. Other instruments offer higher yields as compensation for limited liquidity, like private debt and loans. Others have a nontraditional rate structure—such as floating rate Treasury Inflation Protected Securities (TIPS) or short floating rate notes—but these typically offer lower, not higher, yields. Investors can also boost income by buying longer-dated bonds. However, since we believe there are near-term upward pressures on rates, we are cautious about adding more interest rate risk.
With an outlook for strong economic growth, adding credit risk is an appealing way to boost income. A booming economy can lift the credit worthiness of companies and lower default rates. Although the nearterm credit outlook is positive, investment grade credit spreads (the yield spread over Treasuries) have become so compressed that there is not a lot of value unless one moves to the non-investment grade space. Short dated, non-investment grade bonds look particularly attractive since higher quality short rates, anchored by the Federal Funds rate, are ultra-low.
Non-Investment Grade Securities’ High Correlation to Stocks
Investors need to be aware that non-investment grade securities have a higher correlation to the stock market than investment grade bonds, so owning them reduces the diversification benefits offered by Treasuries and municipal bonds. Credit spreads are correlated to stock prices, so credit spreads widen and narrow along with stock prices. It is important to consider this when adding them to portfolios.
Considering Leveraged Loans
There is a segment of the non-investment grade bond market that seems particularly attractive currently, given the present economic outlook. Leveraged loans are commercial loans issued by banks and then syndicated (i.e., packaged and sold) to other banks and institutional investors. Besides offering a substantial pick up over Treasuries due to their lower ratings, they also offer a yield pickup due to their more limited liquidity. In addition, leveraged loans have a unique payment structure where their coupon rates float. They are issued at a spread to the London Interbank Offered Rate (LIBOR) so, as short rates rise, the income from these loans also rises.
This should be a profitable structure to own when the Fed eventually begins to increase its ultra-low Fed Funds rate. Additionally, because leveraged loans are secured, in the event of a corporate default, loan holders are paid first. After loan holders are paid, unsecured bond holders, such as traditional high yield or corporate bonds, will be paid, followed by stockholders. As such, loans have a higher recovery rate—the amount of principal and interest received back in the event of a default—than the other securities.
Adding a small, tactical position of leverage loans to a traditional investment grade bond portfolio not only diversifies an otherwise all-fixed-rate coupon structure, but also can boost income in today’s low-income world.

A Bumpy Road Around the Globe
Eric P. Leve, CFA, Executive Vice President and Chief Investment Officer
March 31, 2021
This is a story of evolution or, in some cases, the lack thereof. Our tale will begin in 1997, the earliest consistent global data, and will carry us through the present. We’ll examine how countries and sectors increased or waned in importance over the course of those 24 years, and we’ll look at where markets stand today and assess relative opportunities around the world given today’s economic and financial situation.(1)
By any measure, the road has been a bumpy one. By 1997, the markets were in the midst of what Alan Greenspan (then Federal Reserve Chairman) described as “irrational exuberance.” In reality, it was just the early stages of what we’d later coin the dot-com era, a bubble that wouldn’t burst until March of 2000. During that run-up we saw the value of the U.S. equity market rise relative to the rest of the world, mostly on the back of a technology stock explosion due to price appreciation and a robust IPO market. Through the ensuing 20 years we have seen periods of non-U.S. equities growing relative to their domestic peers—especially in the period leading up to the Global Financial Crisis (“GFC”)—but we have seen the opposite as well.
The traditional siren song of international equity true believers has always been: “As the rest of the world becomes wealthier and manufacturing moves overseas, these markets, especially emerging ones, will become a bigger piece of the global equity pie at the expense of the U.S.” The fact that this hasn’t yet come to fruition doesn’t necessarily mean it isn’t true. What does beg a thoughtful response is the data reflecting that U.S. equities rose from less than 47% of the global total in 1997 to more than 57% today (Exhibit 1).
The description of this evolution is threefold and having to do with: 1) a vibrant U.S. technology sector; 2) a somewhat unexpected evolution in the emerging markets (“EM”) space; and 3) challenges for developed markets, most notably in Europe.
 Dominance of Tech and Tech Giants
On the first point, mega-cap U.S. technology companies propelled much of the increase in U.S. exposure over this period. If we were to look at a version of Exhibit 1 excluding technology, the picture would be downright uninteresting: the U.S. ended the period exactly where it started, representing just under 41% of global equities. Further, U.S. dominance isn’t in proliferation of technology and technology-adjacent (TECH+) companies. That prize goes to China, which began the period lacking any technology stocks worthy of inclusion in MSCI to today where there are 108 TECH+ (2) companies in the index. Where America rises above the rest is in creating technology behemoths (Exhibit 2).

Emerging Markets Underwhelmed
Over the history we’re examining, Asia is the only region that increased its equity stake in the world. In fact, only four countries across the emerging markets space saw their share grow by more than 0.5%: China, Taiwan, South Korea, and India. As a whole, emerging markets more than doubled their share of the global equity pie, rising from 6.1% of global equities at the beginning of this period to 13.5% at the end. There is a large caveat, however; over 70% of that increase was due solely to China’s growth and its admittance to standard market indices. This final point is a critical one. Unlike most stocks that are typically reflected in MSCI’s indices based on their market capitalization, Chinese shares generally continue to get an 80% discount due to issues around market accessibility (e.g., the lack of derivatives on many Mainland stocks) and the too-short period between trade date and settlement date. While the Chinese market has vaulted from the third smallest equity market to the third largest over this study period, the real size of the market would give it a weighting twice that of Japan, the second largest market behind the U.S.
The story parallel with this regional shift in emerging markets is the dramatic change in sector exposures. A quarter century ago, EM investors were buying a lot of raw materials for export, banks to support local finance, utilities, and old-line telecommunications companies that provided phone service. Today, they are buying companies that represent the future of the world’s economy, as shown by the right-hand axis on Exhibit 3. Emerging markets used to be the area investors looked for basic materials; today it is the place to look for companies at the cutting edge of technology.
The chart also reflects another dramatic swing. Exhibit 3 begins with a near-equilibrium of exposures to the three broad regions of emerging markets: Asia, Latin America, and EMEA (Europe/Middle East/Africa). Over the next two decades, that balance tilted heavily to Asia, greatly minimizing Latin America and EMEA. And so, Asia’s strengths came to define the emerging markets.
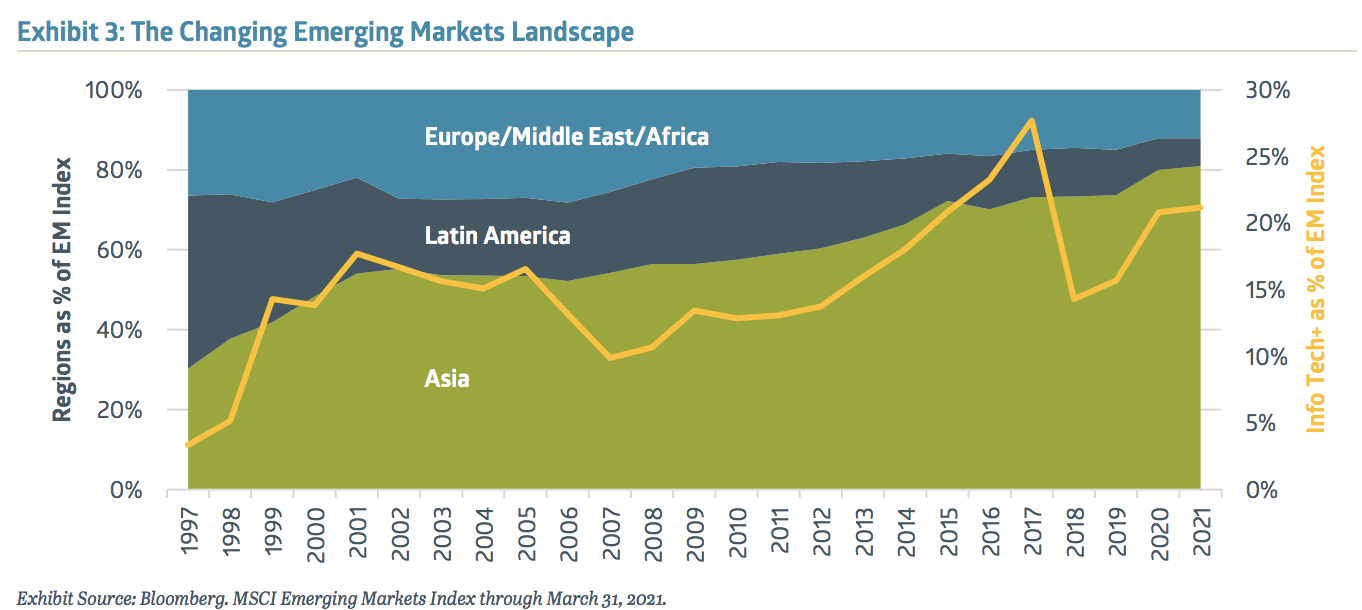
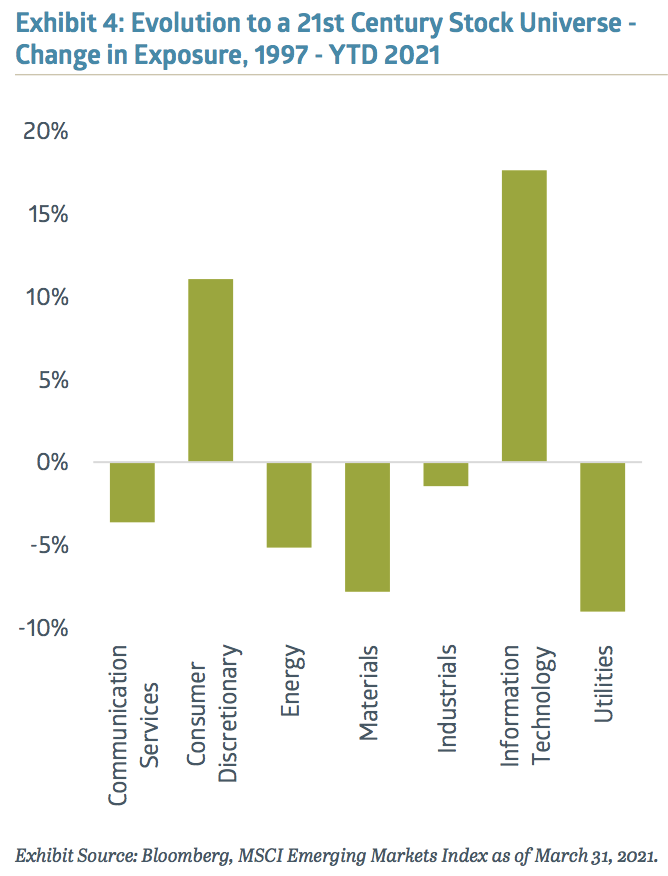 Exhibit 4 digs deeper at this evolution. Communication Services’ 4% decline over the period hides the interim reality that the space shrunk by more than twice that through 2017, as old-line telecom became a much smaller piece of the economic pie. The resurgence of the sector was based on the growth of next-gen EM communications companies such as Tencent and Baidu. Consumer Discretionary’s rise is similarly a story of sector evolution. Previously dominated by auto companies and old-line retail, it is now led by cutting edge e-commerce companies from around the globe. Finally, what stands out most is the dramatic rise in Info Tech paired with the sharp declines in Energy, Materials, and Utility stocks, making the emerging market space look increasingly like exposures in the U.S. stock universe.
Challenges in Europe
The developed markets story is one dominated by Europe. The formation of the European Union (“EU”) occurred in 1993 followed by the introduction of the euro as its currency in 1999. Since that time, the region has experienced what could generously be described as teething pains. And the fragility of a body with unified monetary policy but independent fiscal policy and disperse power wasn’t readily apparent until the GFC. The ensuing decade-plus pushed this system to its limits, leading to a Greek debt default in 2015 and the Brexit vote in 2016. Only last fall did the EU accept the long overdue reality that without some coordinated fiscal policy, the noble experiment was doomed.
The impact of these two lost decades for investors is profound. Over this period, these developed markets (Europe, Australasia, and the Far East or “EAFE”) dropped from just under 45% of global equities to 26%. U.S. tech, the rise of EM Asia, and Europe’s “own goal” drove this decline.
From Today’s Vantage Point
There are two positives for the EAFE markets, and Europe in particular. Europe’s move toward a fiscal union is the tough choice that has attractive potential to make the region become a world leader again. And Europe’s current mix of companies and sectors is very well-suited to capturing accelerating global economic growth. Relative to the U.S., this group has much higher exposures to Industrials, Materials, and Financials. Between what appears to be a global V-shaped economic recovery (with a lag in Europe due to a poor COVID-19 vaccine roll-out) and the push by the U.S., European, and Chinese leaders for massive infrastructure programs, these sectors may enjoy the kind of boom we saw in the mid-2000s when a commodities super-cycle led strong gains throughout the non-U.S. equity space.
As we exit from the COVID-19 year, markets are different in valuation, make-up, and opportunity as well as perception. On top of this, emerging markets continue to be places where burgeoning middle classes drive strong economic growth and the creation of innovative companies. Among developed markets, Europe remains a center for great engineering and production of next-generation industrial goods. Together, these undercurrents of non-U.S. equities could be the market leaders through the next investment cycle.
1 For the purposes of this article, the investment universe we are considering in all cases is the MSCI All Country World Index, which includes 85% of the capitalization of all markets considered by MSCI to be either Developed or Emerging.
2 TECH+ in the case of China is defined as the Information Technology sector plus Tencent, Alibaba, and Baidu; this narrow definition understates the real size of the space.

Closing Brief - Bailard’s View on the Economy: Just Another Manic Meme-Day
Jon Manchester, CFA, CFP®, Senior Vice President, Chief Strategist – Wealth Management, and Portfolio Manager – Sustainable, Responsible and Impact Investing
March 31, 2021
Online trading platform Robinhood launched in 2013 with a mission to “democratize finance for all.” The Menlo Park, CA-based firm offered free trades, no minimum balances, and one share of a stock to sign up. A year later, the app debuted on Apple’s App Store with a waitlist of reportedly one million users. The colorful, intuitive interface catered to millenials. “People like us can trade just like the big guys,” said their introductory video.
Millennials—the first generation to grow up with widespread access to video games—readily embraced the app, which until recently celebrated a user’s first trade with confetti animation. Daily push notifications aim to keep users engaged, and an ecosystem of (mostly) merry men arose around Robinhood on sites including Reddit and TikTok, with influencers touting their trading acumen. A TikTok video earlier this year went viral in which a user named Chad explained his sophisticated strategy: “I see a stock going up and I buy it – and I just watch it until it stops going up and I sell it.”(1)
The app’s popularity soared with its target demographic and, by 2019, Robinhood boasted six million users. The sheriffs of the brokerage forest could no longer ignore this upstart. Within a two-day span in September 2019, E*Trade, Charles Schwab, and TD Ameritrade matched Robinhood with free trading. The little guy had triumphed; finance was more accessible to all. A neat story, if the credits were to roll then. The featurelength film, still in production, offers a more nuanced view of Robinhood’s business model as well as the role of retail investors in setting stock prices.
Marooned at home by the pandemic last year, and with social media fanning the flames, predominantly young investors flocked to Robinhood. By the end of 2020, the app had exploded to around 20 million users.(2) Its fervent followers spawned a new phrase: meme stocks. This refers to investments hyped on social media, with GameStop as the poster child. It was a natural fit, a video game retailer for the video game generation. It was also heavily shorted, a trait shared by some other meme stocks like AMC Entertainment. This made it an even more attractive candidate for the band of traders. The fat cat hedge funds, like the Sheriff of Nottingham, sat on the other side of the trade.
The GameStop saga has yet to find its punch line. In January, the stock rocketed 1,625% higher before plunging 69% in February, only to shoot back up 87% in March. To say the price volatility is disconnected from fundamentals would be stating the obvious, but the meme stocks seem to be following their own peculiar logic. The strange machinations within certain slices of the investment world prompted The New York Times to issue a “March’s maddest markets” bracket that included meme stocks (GameStop, Tesla), SPACs (blank check companies), penny stocks, nonfungible tokens, and a few digital currencies.
Break Out the Bubbly?
For Bailard’s investment strategies, these wild meme stock swings are largely a sideshow, but retail traders seem to be having real impacts on markets. A recent Bloomberg article noted individual traders now represent nearly a quarter of U.S. volume on any given day.(3) In January, Goldman Sachs calculated that the 50 most heavily-shorted Russell 3000 stocks had rallied 98% over the prior three months, which they dubbed the most extreme short squeeze over the past 25 years.(4) Elevated demand for penny stocks, companies with negative earnings, and extremely high-growth, high-valuation equities may also be at least partly attributable to the retail segment.
With COVID-19 still very much a threat to economic activity (and human life), speculative trading outbreaks do put us on bubble watch. In late March, news that a largely unknown investment fund called Archegos Capital Management overextended itself with leverage did not help. With details still a bit murky, it appears Archegos had assets of roughly $10 billion, but via borrowing had levered up to owning positions worth nearly $30 billion.(5) When some of those investments went south, Archegos and the banks that lent the firm money had to essentially fire sale those securities. It brought back some unpleasant memories of past leveraged implosions (Long Term Capital Management, Bear Stearns, etc.) but, at this point, Archegos appears to be a cautionary tale, not one indicative of a broader problem.
One reason for cautious optimism is that households and corporations are in reasonably good fiscal shape despite the enormous stresses incurred from the pandemic. U.S. households have accumulated an estimated $1.5 trillion in excess savings since the onset of the pandemic, and Goldman Sachs economists think that number could be $2.4 trillion—or 11% of Gross Domestic Product (GDP)—before “normal” economic life resumes around mid-2021.(6) Of course, this is in aggregate, with many Americans mightily struggling and our woeful inequality picture only exacerbated by events of the past year. At the corporate level, low borrowing costs have immensely helped, and the bond market shows little signs of fear regarding credit risk.

High valuations, a hallmark of stock market bubbles, remain worrisome in certain segments. In some cases, investors have bid up stocks enthusiastically as COVID-19 recovery plays, and the stocks seem richly priced for even a “normal” economic environment. Growth stocks have come under some pressure recently with interest rates on the rise, but this is after an extraordinary run. Over the 2017 to 2020 timeframe, the S&P 500 Technology sector returned 30% annualized, double the overall market’s return. That has left a number of tech stocks stranded, at least temporarily, at higher valuations as the tide moves slowly out.
According to Bernstein Research, the most expensive quintile of tech stocks are trading at 17x revenues on a market-cap weighted basis, the highest level since the tech bubble.(7) This is not to suggest that all tech stocks are historically pricey, but there are pockets of the market carrying valuations we may ultimately deem as irrationally exuberant, in retrospect.
Spend Money to Make Money
On the economic front, the U.S. recovery continues apace, albeit with COVID-19 as a governor of sorts. Fourth quarter 2020 real GDP growth of 4.3% capped a pandemic-plagued year in which real GDP contracted 3.5%. Economists are projecting nearly 6% growth in 2021 however, and some think it will end up being significantly higher than that due to various stimulus measures. The residential housing markets remain strong: the S&P CoreLogic Case-Shiller National Home Price Index was 11% higher year-over-year in January, its largest gain since February 2006. In the labor markets, the rapid improvements experienced last summer have slowed considerably, but reopening should bolster the employment ranks. As of quarter-end, total nonfarm payrolls remained approximately 4.5% lower than a year prior.

Meaningful economic tailwinds will continue in the form of fiscal and monetary policies. President Joe Biden’s $1.9 trillion American Rescue Plan boosted direct aid via higher stimulus checks and an expanded child tax credit. Eligible households with children are due to receive $6,600 on average, with the largest families receiving more than $10,000.(8) The Center on Poverty and Social Policy at Columbia University estimates the relief package could cut child poverty in half this year. Next on the agenda is an ambitious $2.3 trillion infrastructure bill, which looks likely to face stiff political opposition. And, in fairly short order, Biden intends to introduce another spending package focused on education, childcare, and other social programs.
It is unclear how far these proposals will get on Capitol Hill, but they seemingly increase the upside risk to economic growth estimates for 2021, given the already strong backdrop. On the other hand, taxes will need to move higher to foot the bills, which would weigh on corporate profits. Goldman Sachs strategist David Kostin estimates that full implementation of Biden’s tax plan would reduce the earnings of S&P 500 companies by around 9% but believes the actual drag on 2022 profits will be closer to 3% if Congress only takes the corporate tax rate up to 25% instead of the 28% proposed. Higher taxes will mostly be background noise if corporate earnings follow their projected path. Per Standard & Poor’s, the 2021 estimated operating profits of $172 per share would represent nearly 10% growth over the 2019 pre-pandemic level and a 41% increase versus last year.
On the monetary policy front, the Federal Reserve remains committed to its new “average inflation targeting” policy. This essentially enables the Fed to let inflation run moderately higher than its 2% target for some time before feeling compelled to raise the Fed Funds target rate. Combined with quantitative easing and the fiscal spending spree, market participants are identifying higher inflation as a growing concern. The Fed believes any near-term inflation will be transitory, but bond investors—and digital currency enthusiasts—are not so sure. After bottoming at just 0.55% in March 2020, the 10-year breakeven U.S. Treasury rate (implied inflation) has steadily risen, reaching 2.38% by the end of the first quarter.
According to Raymond James Chief Economist Dr. Scott Brown, economists view inflation as driven primarily by two factors: inflation expectations and the degree of economic slack.(9) Inflation expectations are on the move higher, yet still well contained. We know slack (a description of unused resources in an economy) remains in the broader economy in part by the number of unemployed or underemployed in the working-age population. Federal deficits do not seem to be a root cause of inflation (Japan, for example). Nor does growth in money supply, despite Milton Friedman’s well-known statement that “Inflation is always and everywhere a monetary phenomenon….” Inflation remains a credible threat we will be monitoring closely but, in the meantime, it doesn’t hurt to dust off the inflation playbook in case the genie slips out of the bottle.

1 “Robinhood Couple in Viral TikTok Discover Momentum Trading,” bloomberg.com, 1/19/2021
2 “Robinhood’s Reckoning: Facing Life After GameStop,” wsj.com, 2/5/2021
3 “Nothing the Stock Market Does Ever Scares Its Retail Daredevils,” bloomberg.com, 3/6/2021
4 “Anatomy of a short squeeze,” Goldman Sachs Research, 1/29/2021
5 “What Is Archegos and How Did It Rattle the Stock Market,” wsj.com, 3/30/2021
6 “Bubble Puzzle: A guide to bubbles and why we are not in one,” Goldman Sachs Research, 3/22/2021
7 “Expensive tech is still expensive,” Bernstein Research, 3/22/2021
8 “Which Families Will Receive the Most Money From the Stimulus Bill,” nytimes.com, 3/12/2021
9 “Weekly Economic Monitor – The Inflation Outlook,” Raymond James, 2/12/2021

A Special Letter from Bailard’s CEO, Sonya Mughal, CFA
Humbled and honored. These are the words I keep coming back to as I have accepted the post of Chief Executive Officer at Bailard. Peter Hill, CEO from 2008 through this spring, has dedicated 36 years of his life (and counting) to Bailard and its stakeholders. The pursuit of excellence embodies his career, particularly the pursuit of excellence without cutting corners. Throughout his leadership, Peter devoted his time to take us to the next level through his steady guidance. All with a great deal of patience, and always doing the right thing.
Early achievements in Peter’s tenure include building out Bailard’s institutional client base with our asset allocation consulting business, something that was quite novel and not pursued by many in the industry. Soon after, Peter transitioned into the role of Chief Investment Officer where he steadily grew the team, always trying to hire the best.
A passionate believer in active management, he built a tremendous investment management team, one that could serve clients across many different asset areas. And when Tom Bailard began to think about his retirement and succession, Peter was appointed as the Firm’s first non-Founder CEO in 2008. This turned out to be no easy task. A few short months in, we faced the worst financial crisis that since the Great Depression, putting our clients and the Firm under tremendous stress. Having a steady hand and guiding the company through that crisis was no small feat.
As the waters were beginning to calm after Peter started his role as CEO, we also began the search for liquidity for the company’s largest shareholder. Maintaining our independence has been near and dear to us as a Firm, and Peter faced this question with a fresh perspective. And after a dalliance with an investment banker, and other forms of capital, he reaffirmed the belief that the best way to honor Tom and to continue to build Bailard was to remain independent. And so started the out-of-the-box thinking, something that is innately “Peter”! Having solved one of the most important issues for us as a Firm and managed through one of the biggest financial crises in recent memory, Peter turned his attention to the future.
Inspired by his nephew who won a Gold medal at the 2012 Olympic Games in London, Peter came back enthused. “Let’s have our own ‘Olympic’ plan.” The beauty of it? You can’t change the date! You set a goal and you work towards it, day by day, one foot in front of the other. Because you’re taking the entire company on this journey, you measure your progress and you regularly report your results, good or bad. In the words of our CIO Eric Leve, “Peter’s greatest gift is his vision. He takes an inspired, long view of the landscape and strives for big goals.” The Olympic plan was this vision in action.
An “Olympic”-sized plan meant Olympic-sized goals. And thus we endeavored to double assets under management and revenues within a four-year time frame. It was courageous, and it required everyone to pull on the same rope, to believe in the same dream. “Are you on the bus or not?” he asked at an all-company meeting once. And he meant it.
From guiding Bailard through the 2008 financial crisis and fostering our independence to setting ambitious goals and spearheading the launch of the Bailard Foundation, Peter has consistently been a steady, determined leader. Our EVP of Real Estate, Preston Sargent, notes how Peter was able to lead Bailard through so many years of change, saying his “thoughtful, calm, and reassuring leadership style was ideal to guide the Firm.”
Among these accomplishments is one that is less defined, but still impactful. Shifting a Firm’s focus without changing its core culture is not an easy task, but one Peter managed without fail. Our Vice Chairman, Burnie Sparks, summarizes it well, noting Peter was, “instrumental in some of the Firm’s most dynamic growth in its history. That growth was no accident. It was led and nurtured.” To me, that has been one of his greatest achievements.
Bailard was built on tremendous openness and transparency. Our stated values are accountability, courage, compassion, fairness, excellence and independence, each one as important as the next. Never losing sight of these values but with an eye to making the company even better for our clients, our employees, and our shareholders was Peter’s goal. One that he has very humbly achieved, taking little credit along the way, but making the Firm stronger and more competitive today than when he took over.

Human Trafficking: Issue Brief
The modern investor doesn’t often think about slavery. They may even think it ended with the 13th Amendment in 1865. But even as the effects of slavery in the United States still impact the African American community today, modern slavery menaces the lives of millions of people across the globe despite largely being hidden from the public eye or the brokerage statement.
Bailard Named a 2021 Best Places to Work for Financial Advisers by InvestmentNews
Bailard is proud to announce our recognition as a 2021 Best Places to Work for Financial Advisers by InvestmentNews for the second year in a row. Bailard was chosen as one of this year’s top 75 based on employer and employee surveys delving into company culture, benefits, career paths, and more, ranking fourth out of 25 in its category of 50+ employees.
This recognition is further proof that here at Bailard, we live by our values – including compassion, courage, and excellence – which inform our company’s culture. While this is the first industry recognition of 2021, the award from InvestmentNews comes after a year of achievement for the Bailard team, including wins from both 2020 CNBC FA 100 and Pensions & Investments Best Places To Work In Money Management Award in Q4 of 2020.
“Every day, I am proud of the excellent team we have at Bailard. While this public recognition is exciting, the greater honor is that this came as a result of direct feedback from the people who make our firm great,” said Sonya Mughal, COO and CRO at Bailard. “As we have all grown used to a new way to work and connect with our colleagues, it is comforting and inspiring to see how we have continued to maintain what makes Bailard special.”
As Bailard continues to grow and evolve in 2021, our commitment to excellence in the firm’s culture, and our investment in our best-of-class team will remain steadfast. Kyle Berkley, who joined Bailard as the Vice President of Human Resources last year, will lead this charge through new initiatives and continued traditions that have created our industry-leading culture.
“Continued investment in top talent is integral to our growth as a firm. When the pandemic hit last year, we reimagined our hiring process and programming, leaning on our foundational core values to drive our decision-making” Berkley said.
InvestmentNews partnered with Best Companies Group, an independent research firm specializing in identifying great places to work, to compile the survey and recognition program.
“We’ve all seen the value of a great work culture over the past year, and InvestmentNews is excited to once again recognize those firms that are taking a lead in providing great financial advice and being a great place to work,” said George Moriarty, Chief Content Officer, InvestmentNews. “These firms are leading the industry in developing best-in-class human resource practices.”
To learn more about the InvestmentNews 2021 75 Best Places to Work for Financial Advisers, please go to Bestplacesforadvisers.com.
About InvestmentNews
InvestmentNews is the leading source for news, analysis and information essential to the financial advisory community. Since 1998, our standard of editorial excellence and deep industry knowledge has allowed us to educate, inform and engage the most influential financial advisers. Through a weekly newspaper, website, newsletters, research, events, videos and webcasts, InvestmentNews provides exclusive and up-to-the-minute news, as well as actionable intelligence, that empowers financial advisers to serve their clients and run their businesses more effectively whenever, however and wherever they need it.
The InvestmentNews headquarters are located in New York, with offices in Washington, D.C. InvestmentNews is part of Bonhill Group.
About 2020 InvestmentNews Best Places to Work for Financial Advisers
This award does not evaluate the quality of services provided to clients and is not indicative of Bailard’s future performance. There was no cost for Bailard to enter. InvestmentNews partnered with the Best Companies Group, an independent research firm specializing in identifying great places to work, to conduct a two-part survey process of employers and their employees. The first part consisted of evaluating each nominated company’s workplace policies, practices, and demographics. This part of the process was worth approximately 25% of the total evaluation. The second part consisted of an employee survey to measure the employee experience. This part of the process was worth approximately 75% of the total evaluation. The combined scores determined the top companies. To have been eligible for consideration, companies must meet the following criteria: have a minimum of 15 employees working in the United States; must be in business a minimum of one year; and be a registered investment adviser (RIA), affiliated with (but not an employee of) an independent broker dealer (IBD), or a hybrid/dually-registered firm affiliated with an IBD and doing business through an RIA. This year, a total of 75 firms were placed on the 2021 InvestmentNews Best Places to Work for Financial Advisers list. 25 advisers were recognized in Bailard’s category of Large Employer (50 or more U.S. employees) and Bailard was ranked fourth.
About the CNBC FA 100 Methodology
CNBC enlisted data provider AccuPoint Solutions to assist with delivering the CNBC FA 100 ranking of registered investment advisors. The methodology consisted of first analyzing a variety of core data points from AccuPoint’s database of financial services firms. This analysis started with an initial list of 37,369 RIA firms. AccuPoint then applied weighted categories to further refine and rank the firms, ultimately creating the list of the top 100. The primary data points used in the analysis were reviewed, either as a minimum baseline or within a range, eliminating those firms that did not meet our requirements. Once the initial list was compiled, weightings were also applied accordingly. These data points included: disclosures; number of RIAs employed by each firm; number of employees; number of investment advisors registered with the firm; the ratio of investment advisors to total number of employees; total assets under management; percentage of discretionary assets under management; total accounts under management; number of states where the RIA is registered; and country of domicile. Bailard ranked #86. This award does not evaluate the quality of services provided to clients and is not indicative of the practice’s future performance. Neither the RIA firms nor their employees pay a fee to CNBC in exchange for inclusion in the FA 100.
About 2020 Pensions & Investments Best Places to Work in Money Management
This award does not evaluate the quality of services provided to clients and is not indicative of Bailard’s future performance. There was no cost for Bailard to enter. This year, a total of 94 firms were placed on the Pensions & Investments Best Places to Work in Money Management list. 23 managers were recognized in Bailard’s category of 50 to 99 employees. There was no fee for Bailard to enter.
To have been eligible for consideration, companies must meet the following criteria: be a for-profit or not-for-profit business or public agency; have a facility in the United States; have a minimum of 20 full and/or part-time employees working in the United States; must be in business a minimum of one year; and have at least $100 million of discretionary AUM.
Chat with the CIO: Tech for the Long Run
This quarter features Chris Moshy, Senior Vice President, Domestic Equities and Chief Investment Officer, Eric P. Leve, CFA, as they dive in to the multifaceted case to be made for technology as a staple in long-term portfolios.
March 31, 2021
Eric P. Leve, CFA: What a year for tech. As you and I chat today, we’re just one year (and a few days) past the market lows of March 23, 2020. In the one-year period since that day, the technology sector enjoyed nearly a 91% total return (as measured by the S&P North American Technology Sector Index) and, in recent weeks, also experienced increased volatility.
Chris Moshy: A wild ride, indeed. However, as long-term investors, we recognize that technology companies are at the heart of global economic growth and, in many ways, 2020 was a transformative year for the sector. We also understand that the past year’s run up in equity prices might give some investors pause, but let me make the case for tech’s central role in long-term investment portfolios. It’s really driven by two themes: the broad and accelerating impact of technology on consumers, businesses and society, as well as the fact that technology companies generate superior operating results.
Eric: Given that this conversation is taking place on a public tech company’s video service using cloud-based storage over high-speed internet, by all means, let’s hear it. Could you set the stage for me with a bit about the reach of technology today?
Chris: It’s undeniable. From retail and entertainment to oil and gas, finance, manufacturing, or any number of other industries, technology is likely playing a key role in managing and growing that business. Video and social media sites are hosted by behemoth cloud-based storage and computing platforms. Just because you might not be addicted to a smart watch on your wrist doesn’t mean that a mind-boggling amount of software, hardware, and artificial intelligence algorithms aren’t touching your daily life.
Eric: And that’s why we’ve seen investors dive in, fueling tech’s outperformance and higher valuations.
Chris: That’s certainly the first pillar I mentioned. Today, technology products and services are the primary growth drivers for most industries throughout the world’s economies. But there’s more to it than just the pervasiveness of tech in our lives.
Fundamentally, technology companies, in the long run, generate superior operating results compared to other industries. Tech companies grow sales at close to twice the rate of their non-tech counterparts and, on average, increase operating profits 60% faster.(1) Moreover, the faster growth in the tech sector is accompanied by higher profit margins, lower balance sheet leverage, and superior returns on invested capital.
Eric: What really strikes me is technology’s influence across almost all sectors. I’m thinking of how Apple several years ago became the world’s largest watch maker, and the Apple Watch actually outsold the entire Swiss watch industry starting in 2019.(2)
Shifting now to tech’s versatility, could you elaborate on the opportunities to trade within the sector?
Chris: Absolutely, Eric. Tech isn’t a one-dimensional investment. It’s so pervasive that you can exploit a cyclical economic shift within the sector itself.
Take this example. An investor that has determined the economy is shifting toward economic recovery would generally favor more cyclical industries and would perhaps trade out of tech and into manufacturing. Our approach is similar in concept but stays within the tech sector. Meaning, you could sell the high-growth analytics software company and then look to invest in tech companies in the manufacturing supply chain, like semiconductors.
Staying within the tech sector, we see companies exposed to a broader set of end market and industries that experience varying levels of cyclical and secular business activity. In this example, that semiconductor company may be benefitting from a cyclical lift in demand from truck and auto manufacturing while also responding to demand changes from 5G mobile handsets, cloud data center buying patterns, and gaming console product cycles. We feel what is becoming increasingly clear is that technology companies now represent the deepest, most diversified set of opportunities within both cyclical and secular growth industries.
Eric: But what about the volatility? Even looking beyond the last few weeks where tech has started to slow its meteoric rise, technology companies have long traded at a premium to the broader market. For exactly the reasons you mentioned earlier, investors apply higher valuations.
Chris: Indeed they do, and technology sector returns also have higher volatility than non-tech counterparts. Yet, investors should take a moment to normalize those outsized valuation multiples for the differences in growth rates. The intrinsic value of the faster growth, higher profits, and better returns on investment often justifies the higher valuations of technology equities. We also find the higher returns of technology-driven companies adequately compensate for the higher volatility of share prices.
And, I can guess what your next question will be, Eric. Yes, in fact, the tech sector has shown volatility year-to-date as it dipped in mid-February and ended the quarter up 3.4%, or about half the S&P 500 return for the same period (total return, as measured by the S&P North American Technology Sector Index). In the tech sector, we have seen a similar rotation to reopening and recovery plays with some industry sectors, such as semiconductors, returning 10% in the first quarter.
Conversely, tech investors experienced a sell-off in high growth stocks. Many of the quick-growing software companies aren’t yet generating profits and their cash flow time horizons are too long for investors’ appetites right now. Piling on, high growth stocks are typically out of favor in a rising interest rate environment like we find ourselves in today. But we hold to the fundamental thesis based on the dominance and superiority of tech companies and, historically, after interest rates stabilize, the tech sector has been a strong performer.
Eric: Thanks Chris. As machinery and devices become more complex and powerful, technology-driven companies will only become more central, which only strengthens the case for tech as a staple in investment portfolios. As always, I appreciate both your passion and the opportunity for a deep dive into the fundamentals!
1 S&P 500 Tech-plus Universe versus S&P 500 non-tech counterparts as of 12/31/2020. Analysis based on the securities held in the S&P 500 index. Sources, Standard & Poor’s Financial Services LLC:, Bloomberg, L.P., and Bailard, Inc.
2 https://www.cnbc.com/2020/02/06/apple-watch-outsold-the-entire-swiss-watch-industry-in-2019.html