Country Indices Flash Report – October 2023
The Israel-Hamas war has contributed to dollar strength during the month and reminded the world of the fragile geopolitics of the region. Middle Eastern markets felt the most pressure. Oil prices, while volatile, haven’t risen substantially since October 7th. Alternatively, safe-haven gold has risen almost 9%, approaching $2,000 / ounce.
Quarterly International Equity Strategy Q3 2023
After a very strong first half of 2023, non-U.S. stocks faced a more challenging environment in the 3rd quarter. Developed market central banks regained a measure of credibility in their battle against inflation and appear to be near the end of their respective rate hike cycles (Japan is an exception here). Unfortunately, longer-term yields rose around the world, putting pressure on equity valuations. Adding to the challenge for U.S.-based investors, dollar strength weighed on overall returns as well. Still, earnings growth overseas has outstripped that in the U.S. in 2023 and valuations in the largest foreign markets are very cheap historically. Sentiment towards international stocks has improved dramatically, most notably for Japanese shares. We continue to be cautious with emerging market exposures, especially with respect to China, where the political and economic climate have weighed heavily on equities. With the normalization of central bank activity, the overvalued dollar could revert, providing a strong backdrop non-U.S. stock performance.
Corporate Engagement Update Q4 2023
Bailard’s approach to corporate engagement focuses on both the shareholder process and supporting other stakeholders working to improve disclosures on important environmental, social, and governance (ESG) issues.
Navigating Commercial Real Estate Cross-Currents by Focusing on the Long Term
Jamil Harkness, Research and Performance Associate, explains how investing wisely in private real estate requires patience, prudence, and a focus on fundamentals rather than market timing.
Commercial real estate (CRE), once an easy and upward path, has become more treacherous. This highly favorable period from Q1 2010 to Q2 2022—when the National Council of Real Estate Investment Fiduciaries (“NCREIF”) Open-End Diversified Core Equity Real Estate Index (“NFI-ODCE”) enjoyed an extraordinary streak of favorable positive performance in 49 of the 50 quarters—is now in the rear-view mirror. This “Goldilocks” era for real estate was driven by steady economic growth; providing a stable base for favorable real estate fundamentals, historically accommodative capital markets with abundant and inexpensive debt and equity supporting a robust transaction market, and unprecedented yield rate compression pushing values up.
Starting March 17, 2022, real estate hit a rough patch when the Federal Reserve (the “Fed”) embarked on its most aggressive interest rate-raising cycle in four decades, aimed at slowing the economy and staunching runaway inflation. Over the past ~18 months the Fed has hiked rates eleven times (from 0% to 5.5%), yet the economy has continued to grow, consumers have continued to spend, and businesses have continued to hire. Private real estate, on the other hand, reacted quickly to the Fed’s actions. Interest rates are now at pre-Great Financial Crisis (“GFC”) levels, and values for the four major property types have fallen by approximately 12.3%, on average (Q3 2022 through Q2 2023, as reported by NFI-ODCE).
 Though Q3 2023 returns for the NFI-ODCE won’t be finalized until the end of October, the Bailard Real Estate team believes it is likely that the Index will register its fifth straight quarterly decline. This is the longest string of negative performance since Q3 2008 to Q4 2009.Amid this five-quarter pullback, and with little prospect that the Fed will ease rates any time soon, the entire industry (investors, lenders, intermediaries, service providers, and others) is wondering when real estate values will hit bottom. Predicting any market bottom is, as they say, a “fool’s errand.” We will know it only after it has actually registered its low point. This time will be no different. There are, however, some markers that may help illuminate where the market stands and when a bottom might be forming.
Fundamentals and Capital Markets
The current real estate recession has been driven substantially by capital markets factors. Unlike previous real estate downturns, three property types—multifamily, industrial, and retail—have maintained mostly solid fundamentals. Despite localized oversupply (e.g., industrial in Dallas, Denver, and San Jose… and multifamily in Atlanta, San Antonio, and Phoenix) pushing vacancies up and rents down, there has not been any widespread overbuilding that characterized previous downturns in the early 90s, early 2000s, and from 2005 to 2007 leading up to the GFC. As a result, these property types, while negatively impacted by the capital market’s effects, have so far experienced relatively modest value declines. Office properties are a different story. Fundamentals are abysmal, investor sentiment is in the tank, and return requirements have “blown out.” Much of the sector is priced as if the property type is permanently impaired.
The Impact of Interest Rates
The 10-year U.S. Treasury rate serves as a key metric for two primary reasons. First, because most CRE investors view the asset class as a “long-term” hold, benchmarking against a longer-dated “risk-free” bond has been a traditional way to properly fit property pricing into a risk/return construct. Second, institutional lenders (i.e., banks and insurance companies) use 10-year Treasuries (and shorter-dated T-Bills) as the index to price 2, 5, 7, and 10-year mortgage loans. Since debt is the grease that keeps the real estate transaction machine running smoothly, the cost and availability of mortgage money is critical to a healthy and active investment market.
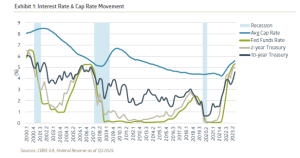
For most of the past 40 years, real estate capitalization rates1 have been between 100 and 300 basis points2 higher than the 10-year Treasury rate. During that period, it’s been as wide as 400 bps and as narrow as 0 bps. There are several reasons real estate has typically traded at a discount to a 10-year Treasury including illiquidity and risk. Exhibit 1 shows the interesting relationship between interest rates and cap rates over the 23-year period since 2000.
As of September 30, the Fed’s aggressive actions have pushed the 10-year Treasury to 4.59% (a jump of 161 basis points over the last 18 months), and the average cap rate for major asset types to 5.6% (an increase of 116 basis points over the same time span).3 The future direction of interest rates plays a pivotal role in shaping cap rate movement and CRE values.
Real Estate Mortgage Delinquencies
Surging mortgage delinquencies typically signal losses for banks, especially when property values dive below loan balances and/or property cash flows fail to cover debt service. Rising losses often cause lenders to alter their terms, including higher rates, lower proceeds, more stringent credit standards, and stricter covenants. These conditions amount to tighter lending standards and/or pull back entirely from the market, which limits options for borrowers and makes debt capital more difficult to obtain. Some of those bank losses become bank (or insurance company) “Real Estate Owned” (REO), and are spit out at fire sale prices exerting further downward pressure on values and negatively influencing investor sentiment.
Currently MSCI Real Capital Analytics projects that $566 billion of real estate-backed loans will mature by the end of 2025, necessitating refinancing in a challenging environment. This will likely inflate delinquency rates. Federal regulators have recently provided policy guidance to encourage lenders to work with borrowers to resolve impairments and potential delinquencies to limit damage and mitigate losses.
In Q2 2023, banks’ delinquent CRE loan balances escalated to $18.2 billion, marking a sharp 36% increase year-over-year. Consequently, delinquent CRE loans now account for 1.01% of total CRE loans.4 For comparison, CRE loan delinquencies hit 11.8% in Q2 1991, 1.9% in Q3 2001, 8.9% in Q1 2010, and 1.1% in Q4 2020. By historic standards, the rate of CRE delinquencies is still a pittance, but most market observers expect the numbers to rise as loans that were issued in the 2015 to 2020 timeframe mature over the next two years. Approximately 46% of banks have tightened their standards as of Q2 2023. Furthermore, average mortgage rates have jumped from 3.7% in early 2022 to 7.9% in Q2 2023.5
Public REIT Performance
The NAREIT Equity REIT Index, reflecting the performance of publicly traded REITs, can provide real-time insights into market sentiment and a snapshot of investors’ expectations. As such, activity in the public arena often acts as a leading indicator of private real estate.
Historical data supports this linkage. For instance, during the GFC, the NAREIT Equity REIT Index first reported negative returns in Q2 2007, followed by the NFI-ODCE reporting negative returns five quarters later in Q3 2008. Recently, history repeated itself: the NAREIT Index showed negative returns for three consecutive quarters starting in Q1 2022, and by Q4 2022, the NFI-ODCE followed suit. The Bailard real estate team believes that a positive turn in the public real estate market may foreshadow improving conditions for private real estate investors and owners.
Timing the Market
It’s important to remember that commercial real estate is a long-cycle asset, requiring prudence and patience. Trading strategies designed for the public markets aren’t generally suited for private real estate investment. The go-go days from 2010 through 2022, with markets awash in cheap and plentiful debt capital, were unusual and allowed market timers to harvest quick gains like house-flippers in the mid-2000s. This was all fueled by the Fed’s easy-money policies. That era is in the rear-view mirror and the current re-set is long overdue. It’s back to basics. Money will be made the old-fashioned way by emphasizing leasing and tenant satisfaction, reducing expenses, and carefully allocating capital to manage risk and maximize cash flow. For investors, it’s a return to focusing on the long-term and the inherent benefits of private real estate: income generation, inflation hedge, portfolio diversification with lower volatility and non-correlation with other asset classes, and potential for upside.
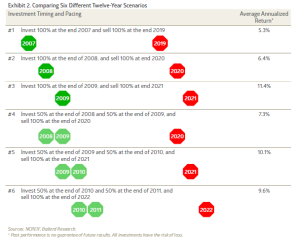
Exhibit 2 shows six different, twelve-year horizon investing scenarios with different timing and pacing, from 2007 to 2010. It’s instructive to see what the returns are for these very different approaches.
This analysis using annualized NFI-ODCE returns revealed that the highest return of 11.4% was achieved by investing fully at the end of 2009 and selling entirely by the end of 2021 (Scenario #3). This result confirms the general belief: investing after a market low allows for a prolonged period to capitalize on market upswings, yielding greater profits. Meanwhile, Scenarios #5 and #6 secured the next best returns at 10.1% and 9.6%. They benefited from strong returns in 2010, 2011, 2015, and 2021. In contrast, Scenarios #1, #2, and #4 garnered the lowest returns (5.3%, 6.4%, and 7.3%), encompassing the GFC’s downturns before recovery. Regardless, all scenarios delivered commendable low volatility returns.
Why It Matters?
Attempting to time a market bottom is a precarious endeavor, often leading to missed opportunities. While the allure of buying low and selling high is every investor’s dream, it’s impossible to do so with consistency due to the myriad unpredictable factors influencing performance. Instead, a more prudent approach is to invest somewhere near the bottom—that is, after a material market pull back—and then exercise patience. By doing so, investors can capture substantial gains during the recovery phase without the stress of trying to pick the bottom. By focusing on the long term and resisting the urge to market-time, investors can achieve solid and sustainable returns, underlining the adage that it’s not about timing the market but rather time in the market.
1 The capitalization rate (“cap rate”) is a measure of an asset’s income over its market value.
2 A basis point (“bp”) is 0.01%.
3 CBRE-EA & Federal Reserve Economic Data (FRED) 2023.
4 S&P Global Market Intelligence “Commercial real estate charge-offs at US banks surge YOY in Q2 2023″.
5 CBRE-EA Quarterly: The Full Picture September 2023.
Impact Investing and the Power of Intention
Annalise Durante, Senior ESG Analyst and Investment Counselor, provides perspective on the indispensable role of impact investing in directing capital towards societal and environmental betterment.
When Dr. Mohammad Yunas won the Noble Peace Prize in 2006 for his pioneering work in establishing Grameen Bank in India, it provided a powerful signal to the world that “impact” investing had arrived. Grameen Bank’s mission was to make small, uncollateralized loans to women in rural India. By the time the Prize was awarded, Grameen Bank had disbursed an astounding $5 billion to over five million women. Today, the impact investing landscape is quite diversified but shares the same goal as Grameen Bank: leverage market solutions to generate profits while also creating positive social and/or environmental impact alongside a financial return.
This sets it apart from ESG investing, which utilizes data on environmental, social or governance (ESG) factors to help identify risk or opportunities, as well as socially responsible investing (SRI), that primarily focuses on aligning investments with stated values, often through exclusionary screening.
“Intention” is a key facet to impact investing. It is more proactive in its pursuit of making a positive impact compared to ESG or SRI. The notion behind impact investing is that governmental and philanthropic funding alone is not enough to solve the world’s problems. According to the Organization for Economic Co-operation and Development (OECD), the annual financing gap to achieve the Sustainable Development Goals is $3.9 trillion.1 It is clear that private capital must also be mobilized alongside public funds to find sustainable and systemic solutions for challenges like climate change and poverty.
Impact investing has helped establish that investment returns and positive impact do not have to be mutually exclusive. In fact, there is a solid business case for making such investments. Within each problem, lies multiple investment opportunities. For instance, addressing climate change presents opportunities in carbon removal, renewable energy, regenerative agriculture, and sustainable materials, to name a few. Similarly, the challenge of poverty opens doors to investment in access to education, healthcare and water, infrastructure improvements, affordable housing, and programs supporting women and minorities. These issues may feel overwhelming, but so is the opportunity to invest in their solutions.
Impact investors range from banks, pension funds, and foundations to individuals, private equity firms, development finance institutions and corporations. Religious institutions have also been key proponents of impact investing, as seen in Pope Francis’ vision of “putting the economy at the service of the peoples.”2 Impact investments can span across asset classes, sectors, geographies, themes, and investment vehicles. According to the Global Impact Investing Network’s (GIIN) annual report, the global impact investing market’s size is roughly $1.16 trillion.3
Broadening Avenues for Impact
Historically, community investing and microfinance played integral roles in impact investing, typically in the form of low-income housing loan funds or promissory notes. However, as private equity emerged as an asset class, it began to dominate the impact investing space as well, either through direct investment in companies or private equity funds. While it was positive that capital was directed toward social and environmental issues, the high minimum investment requirements, and risk profile of private equity often excluded the average retail investor. Fortunately, as impact investing gained steam and more companies incorporated social or environmental impact into their ethos, accessible opportunities to invest with impact expanded.
One approach is to invest in the stock of publicly traded companies that generate positive social or environmental impact through their products or services. At Bailard, we have an investment strategy called Bailard Broad Impact that follows this approach. Impactful investments can also be made within fixed income portfolios. Over the last decade, there has been tremendous growth in bonds whose proceeds are earmarked for environmental or social impact projects. Examples include green bonds for environmental initiatives and social impact bonds linked to social outcomes for service users. Some fixed income instruments also help fund microfinance and community investments.
Often, impact investments are aligned with themes aimed at addressing specific problems. As part of our Bailard Broad Impact investment philosophy, we have identified numerous impact themes that we believe provide investable solutions. For example, the Decarbonization theme seeks to have a positive impact on the issues of carbon emissions and climate change. We may invest in companies that produce geothermal power, generate energy from ocean waves, or electrify transportation. Within the theme of Financial Inclusion, investments target companies working to improve access to capital and banking tools for low-income communities without charging exorbitant interest rates. Each theme encompasses a broad range of industries, sectors, and types of companies that align with its objectives.
 Measuring, Tracking, and Communicating
One crucial component of effective impact investing is impact measurement. Promised impacts must be measured and tracked to ensure accountability. Sometimes impact is straight-forward to measure, such as quantifying carbon emissions or water usage reduction. However, quantifying impact can be difficult and complex, especially when issues involve multiple stakeholders and long-term outcomes. Best practices for impact managers include establishing impact key performance indicators (KPIs) from the outset that can be measured and tracked, and transparently communicating those KPIs to investors. As companies increasingly disclose data related to social and environmental issues—and regulations mandating such disclosure evolve—the practice of impact investing and measurement will continue to improve.
Using investments as a catalyst for change is not a new concept. In fact, some form of impact investing has been present since the inception of capital markets. Municipal bonds, for example, have been around since the very origins of the United States, directing capital into vital infrastructure like highways, schools, hospitals, and airports. With today’s social and environmental challenges far exceeding governments’ ability to solve them, impact investing can play a pivotal role in directing capital to benefit society, the planet, and investors alike.
1 Organisation for Economic Cooperation and Development (OECD. (2022, November 10). Global Outlook on Financing for Sustainable Development 2023: No Sustainability Without Equity. https://doi.org/10.1787/fcbe6ce9-en
2 https://www.viiconference.org/
3 Hand, D., Ringel, B., Danel, A. (2022) Sizing the Impact Investing Market: 2022. The Global Impact Investing Network (GIIN). New York.



Economic Brief: High Yields and Hard Lessons
Against the backdrop of rising interest rates, this quarter’s economic perspective from Jon Manchester, CFA, CFP® (Senior Vice President, Chief Strategist – Wealth Management, and Portfolio Manager – Sustainable, Responsible and Impact Investing) delves into the intricate balance between financial stability and market volatility.
It looked good on paper. Almost any investment yield does, when interest rates are close to zero. The math gets progressively less favorable when borrowing costs normalize. Just ask investors in Atlanta-based Newell Brands, which stables Rubbermaid, Sharpie, Graco, Coleman, and other well-known brands. As 2023 began, the stock offered an enticing 7% dividend yield. For those unable to resist the siren call, the yield turned out too good to be true. By the end of April, Newell’s stock price was down 7% year-to-date, effectively wiping out the indicated annual yield. Then in mid-May, Newell issued a press release announcing the quarterly dividend would be slashed to $0.07 per share from $0.23 previously. According to the company, the dividend “right-sizing” would allow Newell to de-leverage the balance sheet faster, plus fund supply chain consolidation efforts and provide greater financial flexibility overall. The roughly 70% dividend cut sent the stock price tumbling further, and by the end of the third quarter shareholders were left lamenting a -29% total return for 2023 thus far.
As a young man from Northern Minnesota named Bob Dylan once sang, the times they are a-changin’. In July, the Federal Reserve (the “Fed’) hiked the Fed Funds target range to 5.25% to 5.50%, the eleventh tightening in a 17-month stretch. This has intentionally poured cold water on capital markets activity, and therein lies a problem for companies such as Newell Brands who have been more heavily reliant on external financing.
This cautionary tale is another reminder that chasing high yield stocks can be a short-sighted strategy, particularly when a company is overly reliant on cheap financing to make it all work. We should be careful about reading too much into one company’s travails, but it seems likely other highly-indebted companies will encounter similar struggles. With the Zero Interest Rate Policy (ZIRP) days quickly fading from memory, the macroeconomic waters may not be quite as inviting in the near-term. Along those lines, Strategas Research chief economist Don Rissmiller has compared restrictive monetary policy to (collectively) holding our breath under water, and at risk of stating the obvious, he notes the longer we do so the more dangerous.1 The U.S. economy appears adequately buoyant at present, but it is reasonable to fret that the Fed’s aggressive battle against inflation—which is not yet mission accomplished—may cause more collateral damage.
Until Something Breaks
Longer-dated U.S. Treasury yields have risen in part due to greater acceptance of the “higher for longer” narrative. By that meaning the Federal Reserve may plateau the Fed Funds target rate at a restrictive level for a longer period of time than originally anticipated. First, though, the Fed needs to stop hiking, and in late September its “dot plot” indicated that 12 of 19 officials favored another rate increase this year. The Fed’s median projection for the year-end 2024 Fed Funds target rate was 5.1%, only slightly below the current level, and up from 4.6% previously. It’s worth acknowledging that only recently has the Fed Funds target rate actually exceeded the inflation rate. That crossover occurred in June, using the Consumer Price Index (CPI) excluding Food & Energy. For inflation to be truly quieted, the Fed will likely want to see prices remain below the policy rate for an extended timeframe.
Higher rates typically portend trouble for companies with weaker balance sheets. Firms that aggressively borrowed during the funny money years now encounter a new landscape, whether they need to refinance debt or borrow new funds. Equity markets have already started reflecting this in prices. One way to measure financial leverage is to look at a company’s net debt-to-EBITDA (earnings before interest, taxes, depreciation, and amortization) ratio. On a year-to-date basis through September, the S&P 500 companies in the highest decile on that metric produced a -6.6% median total return.2 Dispersion was wide within that decile, with cruise line stocks soaring while Dish Network and other heavily indebted names mightily struggled. The bottom decile—those companies with low debt in relation to earnings—produced a median return of 13.4%. As the tide goes out, it does appear that highly-levered companies are being stranded on the beach.
Goldman Sachs maintains various equity baskets to evaluate how certain factors are performing. Its “Strong Balance Sheet” sector-neutral basket includes 50 stocks from the S&P 500 with high Altman Z-scores, a measure of financial health. As shown in Exhibit 1, this basket of stocks has performed well relative to a basket of “Weak Balance Sheet” stocks over the past decade. Thus far in 2023, the strong balance sheet basket has outpaced the weaker balance sheet stocks by approximately 14 percentage points.3 This factor may be increasingly important as the economic cycle reaches its final stages. According to a Bloomberg article in July, nearly $600 billion of debt globally traded at distressed levels – defined as below $0.80 on the dollar and with a spread greater than 1,000 basis points.4, 5 More than a quarter of the distressed debt is tied to the real estate sector, more than any other industry group. To this point we haven’t seen any widespread outbreak of corporate defaults, although the collapse of Silicon Valley Bank and two other banks in March did briefly rattle investor confidence.
With the Fed’s proverbial foot firmly on the brake, it seems wise to pay close attention to the credit markets for signs of trouble.
Balancing Act
Appearances can be deceiving. There is a strong argument that the 13% total return for the market cap-weighted S&P 500 Index through the first three quarters of 2023 falls under this rubric. In comparison, the S&P 500 Equal Weighted Index managed less than a 2% return, lacking the cap-weighted upside provided by heavyweights Nvidia, Apple, Microsoft, and others. The latter feels more consistent with the big picture, including fairly sluggish earnings growth. Trailing twelve-month operating profits for the S&P 500 of roughly $208 per share through the second quarter were up less than 2% year-over-year. Wall Street expects that growth rate to improve over the final two quarters, but there are questions around the durability of profit growth in the face of higher input and borrowing costs.
U.S. Treasury Secretary Janet Yellen is not worried. When asked in September about the hopes for a “soft landing” in which a recession is avoided and inflation tamed, Yellen responded “I think you’d have to say we’re on a path that looks exactly like that.”6 The improvement in inflation is well documented: from a peak 9.1% rate for CPI ex-Food & Energy in June 2022 to 3.7% in the most recent (August 2023) reading. Yellen also highlighted an increase in labor force participation as “a clear plus” amid some easing in the labor markets. Although not a leading indicator, the U.S. employment picture remains encouraging. Nonfarm payrolls jumped 336,000 in September, while the unemployment rate stayed at 3.8%. This is particularly important because for consumers the excess savings are gone, according to the Federal Reserve’s latest survey of household finances. For the bottom 80% of households by income, aggregate bank deposits and other liquid assets were lower in June 2023 than they were in March 2020, inflation-adjusted.7 For those in the wealthiest quintile, the remaining excess savings were expected to have depleted in the third quarter. Sobering, perhaps, although the same Fed report indicated that household net worth rose approximately $5.5 trillion during Q2 to a record-high.
1 “Weekly Economics Summary,” Strategas Research, 10/1/2023.
2 Bloomberg data, Bailard calculations, 9/30/2023.
3 Strong Balance Sheet US / Weak Balance Sheet US, Goldman Sachs Marquee platform, 9/29/2023.
4 A basis point (“bp”) is 0.01%.
5 “A $500 Billion Corporate-Debt Storm Builds Over Global Economy,” www.bloomberg.com, 7/18/2023.
6 “Yellen ‘Feeling Very Good’ About US Sticking a Soft Landing,” www.bloomberg.com, 9/10/2023.
7 “Only Richest 20% of Americans Still Have Excess Pandemic Savings,” www.bloomberg.com, 9/25/2023.