
Monday Macro with Dave - Tax refunds rise 11%, providing important tailwind to consumers
Monday Macro with Dave
Weekly perspective on current developments, emerging risks, and potential implications for investors.
Tax refunds rise 11%, providing important tailwind to consumers
Dave Harrison Smith, CFA
Chief Investment Officer
April 27, 2026
Tax refunds provide a timely cushion
Tax Day is behind us, and the latest data from the IRS gives us a new read on a source of economic support: tax refunds. This year, the increase in average refund size is meaningful and provides a temporary tailwind for consumers. The average refund in 2026 rose to $3,275, a strong increase of 11.3% over last year. Total refunds rose to $296.1 billion, up $43.0 billion over last year.
Average refund per tax filing
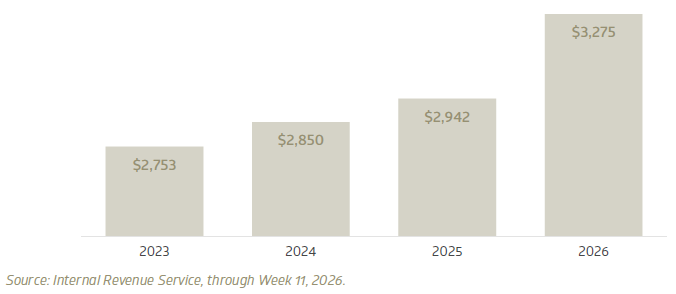
These refunds have come at a critical time for the consumer. Gasoline prices remain elevated with national averages above $4.00, up nearly a full dollar from a year ago. This has acted as an additional tax on American consumers. To date, high-frequency spending data has been relatively resilient, suggesting consumers have absorbed the energy shock. Refunds have clearly played a role. The risk remains that, as the benefit of tax refunds wanes, consumers may feel more of the pinch and pull back their spending in unanticipated ways.
Capital spending remains a source of strength
Consumer spending has been a steady pillar of U.S. economic strength in recent years. The other, undoubtedly, has been corporate investment. Data from the U.S. Census Bureau Durable Goods report highlights the trend. Growth in Non-Defense New Orders, often seen as a proxy for corporate capital expenditures, has continued to post strong monthly and annual growth in 2026, building on a trend that began to accelerate in 2024.
Non-defense new orders, core capital goods
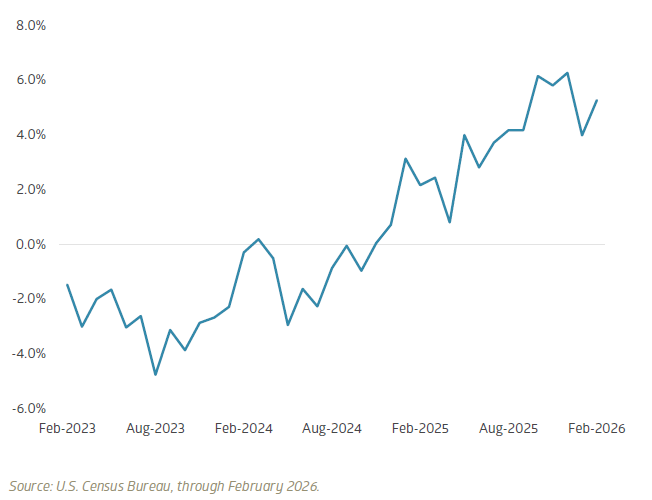
Much of this boom can be attributed to robust investment in artificial intelligence, including data centers and equipment. The key question is durability. Over the coming weeks, we expect to receive several earnings reports that will provide an important signal about the trajectory of AI capital spending. Expectations are elevated, but recent updates from major infrastructure providers have broadly reinforced confidence in the continued build-out.
Energy prices remain the key risk
Overall, the early read is one of continued resilience in the face of global volatility. U.S. consumer data continues to suggest stability, with the benefit of tax refunds helping offset the pain of the energy shock. The labor market is cool but looks to be stabilizing. This, combined with strong capital spending, has supported the U.S. stock market. The durability of the consumer and capital spending is critical to continued strength. Continued elevated energy prices remain a key risk, as higher prices filter through to inflation expectations and erode spending.
# # #
Past performance is no indication of future results. All investments have the risk of loss.
The information in this publication is based primarily on data available as of its publication date and has been obtained from sources believed to be reliable, but its accuracy, completeness, and interpretation are not guaranteed. Bailard undertakes no duty to update any of the information contained herein, and such opinions are subject to change without notice. We do not think this publication should necessarily be relied upon as a sole source of information and opinion. This publication is not a recommendation of, or an offer to sell or solicitation of an offer to buy any particular security or investment product. It does not take into consideration the particular investment objectives, financial situations, or needs of individual clients.
Any indices or other financial benchmarks referenced are provided for illustrative purposes only. Indices are unmanaged, reflect reinvestment of income and dividends, and do not reflect the impact of advisory fees. Investors cannot invest directly in an index. Any individual securities referenced herein are for illustrative purposes only and not necessarily representative of investments that have been made or will be made in the future. Bailard, Inc. makes no recommendation to buy or sell securities discussed herein. Bailard clients may hold positions in the securities discussed and may buy or sell such securities at any time.
Certain information may constitute “forward-looking statements,” which can be identified by the use of forward-looking terminology such as “may,” “will,” “should,” “expect,” “anticipate,” “project,” “estimate,” “intend,” “continue,” or “believe,” or the negatives thereof or other variations thereon or comparable terminology. Due to various risks and uncertainties, actual events, results or actual performance may differ materially from those reflected or contemplated in such forward-looking statements.
Bailard, Inc. does not provide investment advice in jurisdictions where it is not authorized to do so.
Monday Macro with Dave - Consumer resilience meets rising energy costs
Monday Macro with Dave
Weekly perspective on current developments, emerging risks, and potential implications for investors.
Consumer resilience meets rising energy costs
Dave Harrison Smith, CFA
Chief Investment Officer
April 20, 2026
Tracking the consumer spending response to higher gas prices
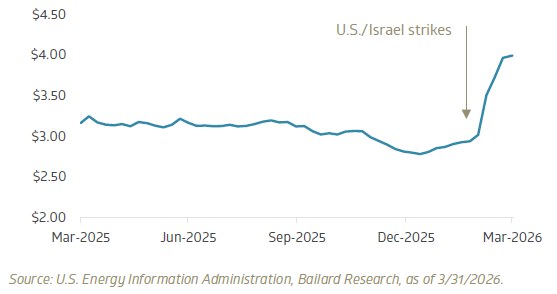
The early transmission of the war in Iran into the U.S. economy has been through gasoline prices. Prices rose a stunning 35.9% from late February through March. This move represents the largest five-week surge since the U.S. Energy Information Administration began tracking the data in 1991. Average national prices have remained elevated in April, hovering near $4.00 per gallon.
National U.S. regular retail gasoline price, trailing year
With several weeks of data now available, we can begin to track the early impacts on consumer spending trends. Studies have found that gasoline demand has historically been relatively inelastic; consumer demand for gasoline does not change significantly despite changes in gasoline prices. Instead, the adjustment typically comes through reallocation of wallet share, with consumers decreasing spend in other categories. Luxury goods and discretionary purchases in particular can come under pressure.
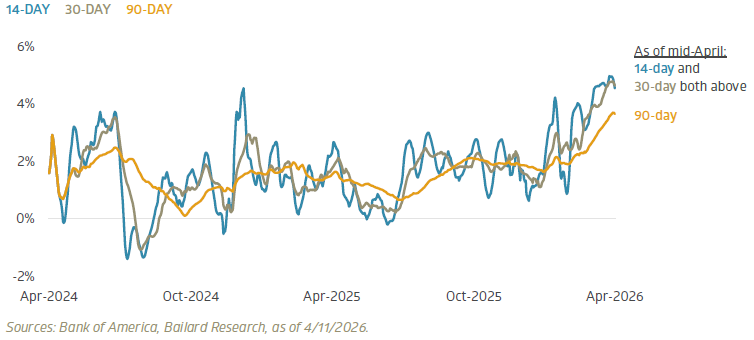
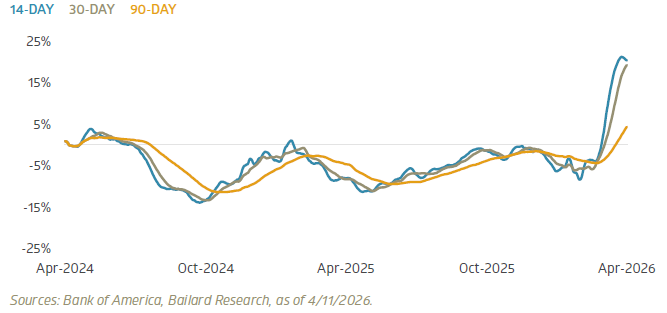
So far, the consumer spending reaction to higher gas prices has been limited. Analyzing near-real-time credit card spending data from Bank of America, overall spending remains resilient through mid-April, with both the 14-day and 30-day moving averages for total card spending above the 90-day average, suggesting a modest acceleration in spending behavior rather than a slowdown.
Credit card spending: 14-, 30-, and 90-day moving averages vs. prior year
Unsurprisingly, spending at the pump has surged. The 14-day moving average of gasoline outlays is up more than 20% versus last year. Notably, this is below the average increase in gasoline prices, suggesting a modest change in consumer behavior.
Gasoline spending: 14-, 30-, and 90-day moving averages vs. prior year
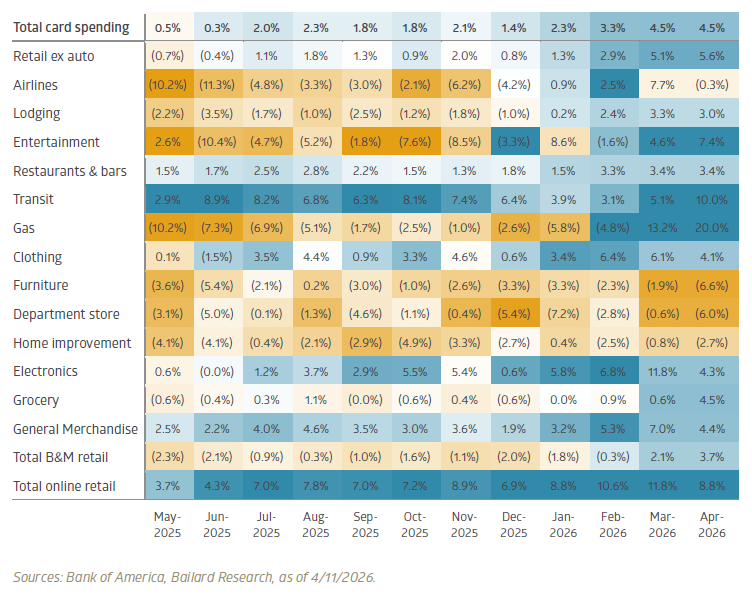
Other categories generally look on trend. Below we show the year-over-year change in average monthly spend, broken down into broad spending categories. Discretionary spending, including general merchandise, clothing, and entertainment categories, continues to track in line with prior trends. Online retail spending, as well, looks firm.
Notably, spending on airlines appears to be an exception. Airline spending reflects a sharp increase in March, followed by a significant slowdown in April. This may reflect a pull-forward in demand, with consumers anticipating rising airfares and booking summer trips early to lock in lower prices. Whether this proves to be a temporary shift or an early sign of demand destruction is an area to monitor going forward.
The broad takeaway is that consumers have remained resilient despite considerable geopolitical and economic volatility. The key question is the duration of that strength. The longer elevated energy prices persist, the greater the economic impact on both inflation and consumption, and the greater the risk that higher costs begin to erode relative resilience.
Retail category year-over-year change heatmap
# # #
Past performance is no indication of future results. All investments have the risk of loss.
The information in this publication is based primarily on data available as of its publication date and has been obtained from sources believed to be reliable, but its accuracy, completeness, and interpretation are not guaranteed. Bailard undertakes no duty to update any of the information contained herein, and such opinions are subject to change without notice. We do not think this publication should necessarily be relied upon as a sole source of information and opinion. This publication is not a recommendation of, or an offer to sell or solicitation of an offer to buy any particular security or investment product. It does not take into consideration the particular investment objectives, financial situations, or needs of individual clients.
Any indices or other financial benchmarks referenced are provided for illustrative purposes only. Indices are unmanaged, reflect reinvestment of income and dividends, and do not reflect the impact of advisory fees. Investors cannot invest directly in an index. Any individual securities referenced herein are for illustrative purposes only and not necessarily representative of investments that have been made or will be made in the future. Bailard, Inc. makes no recommendation to buy or sell securities discussed herein. Bailard clients may hold positions in the securities discussed and may buy or sell such securities at any time.
Certain information may constitute “forward-looking statements,” which can be identified by the use of forward-looking terminology such as “may,” “will,” “should,” “expect,” “anticipate,” “project,” “estimate,” “intend,” “continue,” or “believe,” or the negatives thereof or other variations thereon or comparable terminology. Due to various risks and uncertainties, actual events, results or actual performance may differ materially from those reflected or contemplated in such forward-looking statements.
Bailard, Inc. does not provide investment advice in jurisdictions where it is not authorized to do so.

Bailard's SRII Issue Research & Outreach Library
The 2023 proxy season: More shareholder proposals, tougher proposals, and less support.
Monday Macro with Dave - Inflation picks up as labor market trends begin to diverge
Monday Macro with Dave
Weekly perspective on current developments, emerging risks, and potential implications for investors.
Inflation picks up as labor market trends begin to diverge
Dave Harrison Smith, CFA
Chief Investment Officer
April 13, 2026
Headline inflation jumps but Core holds
On Friday, the Bureau of Labor Statistics released its March CPI report, among the first to reflect the impact of rising energy and gas prices following the strikes on Iran at the end of February.
At first glance, the report came in broadly in line with expectations or even slightly cooler than feared. Headline CPI jumped to 3.3% year-over-year, up from 2.4% the prior month. Core CPI, which excludes volatile food and energy prices, was slightly cooler than expected, aided by a decline in used-car prices.
Core and Headline CPI year-over-year change
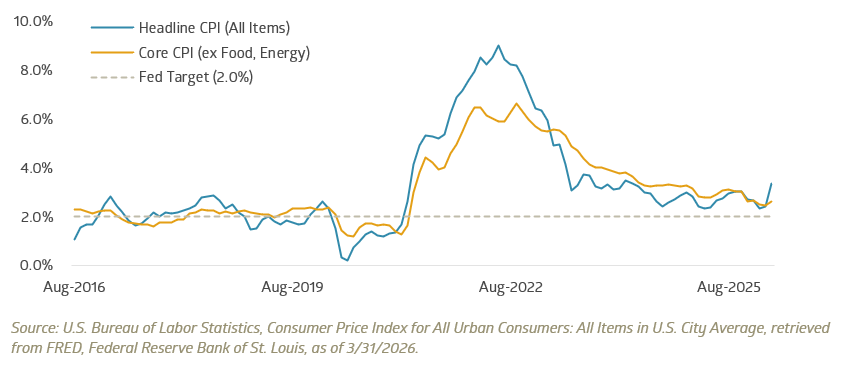
The influence of the war in Iran was evident in the data, with energy prices increasing by 12.6% versus last year and gas prices rising by 21.2%. As expected, pass-through to core CPI was more limited, though signs of impact are beginning to emerge at the margin in the form of prices of delivery services and airfare, which rose 3.1% and 2.7% year over year, respectively.
The broad takeaway is that this report is unlikely to shift the Fed’s stance of holding interest rates at current levels. The pressure on consumers remains, with lower-income consumers particularly hard hit, given their higher share of gasoline spending. The longer the conflict extends, the greater the risk these costs transmit to slower spending growth and higher core inflation, as companies raise prices to offset higher input costs.
Labor market for early-career Americans showing weakness
Last week’s labor market data continued to indicate a stable yet cool job market. Beneath the surface, however, is an increasing divergence in prospects for early-career workers.
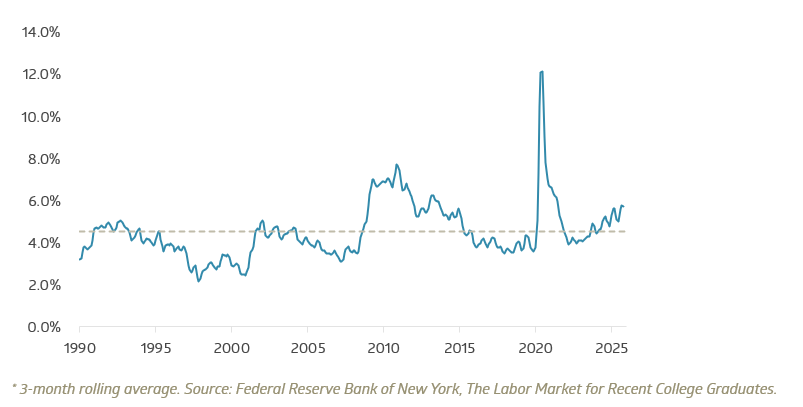
The Federal Reserve Bank of New York recently published new data dissecting unemployment trends for various cohorts of the U.S. labor force. Of particular note was the unemployment rate for new college grads, which has been steadily rising since 2022 and reached 5.6% at 2025 year-end. That level is significantly above historical average and elevated for non-recessionary periods.
Unemployment rate for recent college graduates, smoothed*
Concurrently, research from the Stanford Digital Economy Lab, published by Erik Brynjolfsson et al, examined the impact of artificial intelligence on labor. Their team focused on the growing divide between roles defined as more or less exposed to AI automation. Their findings point to a growing divergence in outcomes, specifically concentrated in early-career employees in AI-impacted roles.
Employment changes by age and level of exposure to AI, from Stanford Digital Economy Lab
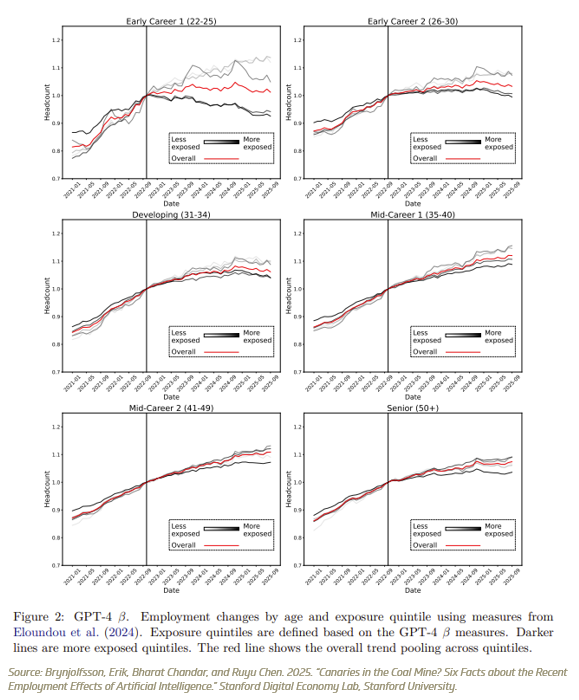
For any of us with children, nieces, or nephews entering the workforce, these findings may come as no surprise. The job market is tough out there for this cohort of the American labor force. While the aggregate labor market looks relatively healthy, AI does appear to be impacting certain segments. The implications for our economy and society are worth monitoring closely.
# # #
Past performance is no indication of future results. All investments have the risk of loss.
The information in this publication is based primarily on data available as of its publication date and has been obtained from sources believed to be reliable, but its accuracy, completeness, and interpretation are not guaranteed. Bailard undertakes no duty to update any of the information contained herein, and such opinions are subject to change without notice. We do not think this publication should necessarily be relied upon as a sole source of information and opinion. This publication is not a recommendation of, or an offer to sell or solicitation of an offer to buy any particular security or investment product. It does not take into consideration the particular investment objectives, financial situations, or needs of individual clients.
Any indices or other financial benchmarks referenced are provided for illustrative purposes only. Indices are unmanaged, reflect reinvestment of income and dividends, and do not reflect the impact of advisory fees. Investors cannot invest directly in an index. Any individual securities referenced herein are for illustrative purposes only and not necessarily representative of investments that have been made or will be made in the future. Bailard, Inc. makes no recommendation to buy or sell securities discussed herein. Bailard clients may hold positions in the securities discussed and may buy or sell such securities at any time.
Certain information may constitute “forward-looking statements,” which can be identified by the use of forward-looking terminology such as “may,” “will,” “should,” “expect,” “anticipate,” “project,” “estimate,” “intend,” “continue,” or “believe,” or the negatives thereof or other variations thereon or comparable terminology. Due to various risks and uncertainties, actual events, results or actual performance may differ materially from those reflected or contemplated in such forward-looking statements.
Bailard, Inc. does not provide investment advice in jurisdictions where it is not authorized to do so.

Social Security: It’s about more than when you claim
Social Security is often treated as a timing decision. Should you claim early, or wait?
That’s part of the decision, but it’s not the whole story. Even for those who may not rely on it, Social Security is one of the few sources of income that lasts for life and adjusts for inflation. How it’s claimed can shape retirement income over many years, particularly for a surviving spouse.
Putting Social Security in perspective
Before getting into the decision itself, it’s worth addressing a common concern.
Social Security is not going away. While the trust fund is projected to be depleted in the early 2030s, that doesn’t mean benefits disappear. Ongoing payroll taxes are expected to continue funding a substantial portion of benefits, currently estimated at roughly 75%, and historically, Congress has stepped in to adjust as needed.
For planning purposes, it’s reasonable to assume Social Security will remain part of the picture.
Framing the trade-off
There isn’t a single right answer here. What makes sense depends on your health, your income needs, and the resources you have available.
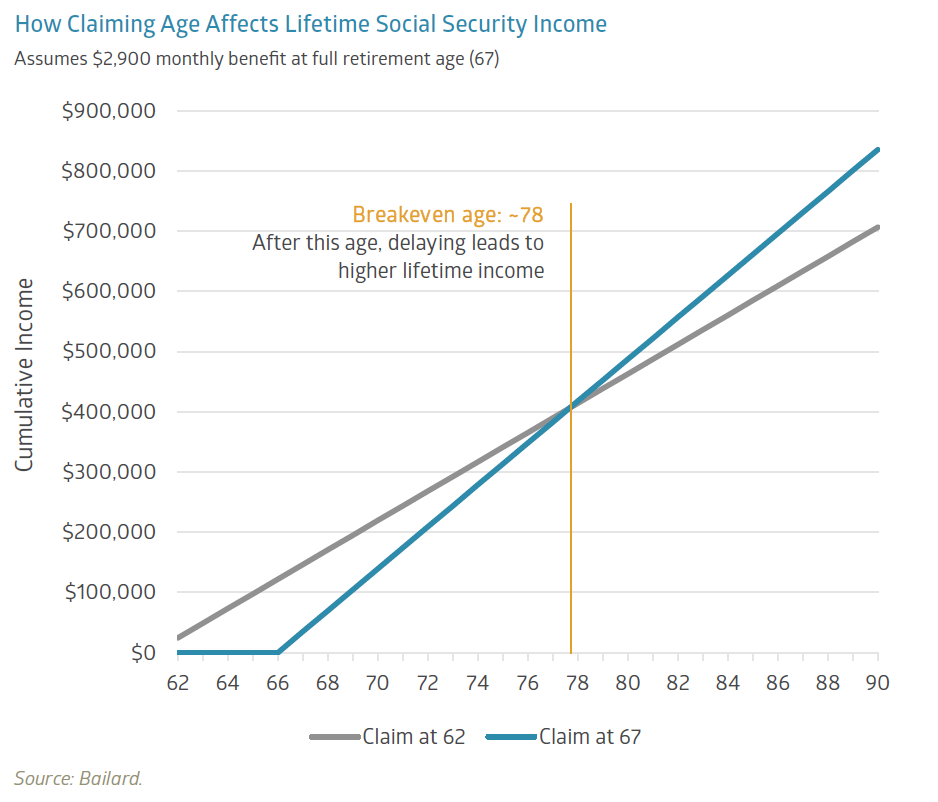
Health and family longevity are a natural place to start. If your health is poor or your family history suggests a shorter life expectancy, claiming benefits earlier may make sense. If you’re in good health, delaying benefits can meaningfully increase your monthly income over time. Claiming at age 62 can reduce benefits by up to 30% compared to waiting until full retirement age. On the other side, delaying beyond full retirement age can increase benefits by roughly 8% per year up to age 70.
One way to think about this trade-off is through the idea of a “breakeven age,” which compares total benefits over time based on when you claim.
In the example below, the breakeven point falls around age 78. If you live beyond that, waiting typically yields a higher total income. If not, claiming earlier may come out ahead.
The math may be helpful, but it’s only part of the story. It needs to fit within your overall plan, especially in how you’re drawing from other income sources. If you have flexibility early on, whether from taxable investments or retirement accounts, it may be easier to delay Social Security and increase your future benefit. When done thoughtfully, that approach can also help manage taxes and reduce required minimum distributions (RMDs) over time.
For couples
 For married couples, the decision isn't just about one person.
When one spouse has lower lifetime earnings, they may qualify for a spousal benefit of up to 50% of the higher-earner’s primary insurance amount (PIA). At the time of filing, Social Security evaluates both options and pays whichever is higher.
There are a few important nuances. Spousal benefits don’t increase beyond full retirement age, and claiming early reduces both the individual benefit and any spousal supplement.
Survivor benefits are where this becomes especially important. When one spouse passes away, the surviving spouse keeps the higher of the two benefits, including any increase from delayed retirement credits (which increase benefits for each year you wait beyond full retirement age, up to age 70). For many couples, that becomes the income floor on which the surviving spouse lives. When the higher earner delays, they increase their own benefit and, in turn, raise the income that remains in place for the surviving spouse.
Other situations to be aware of
Divorced individuals may also qualify for benefits based on a former spouse’s earnings record.
In general, the marriage must have lasted at least 10 years, the individual must be unmarried and age 62 or older, and their own benefit cannot exceed 50% of the former spouse’s PIA. In some cases, benefits may still be available even if the former spouse has not yet filed, as long as the divorce has been finalized for at least 2 years.
Widowed individuals may be eligible for survivor benefits as early as age 60, though those benefits are reduced if claimed before the survivor’s full retirement age. At full retirement age, the full survivor benefit becomes available.
There’s also some flexibility in how benefits are taken. In certain situations, it may make sense to start with a survivor benefit and switch to your own retirement benefit later, or the other way around, depending on which approach leads to higher lifetime income.
Taking a broader view
Social Security is one of the few sources of inflation-adjusted income that lasts for life. That makes it worth thinking about as more than just a timing play.
What matters is how it fits within your broader plan. Health, longevity expectations, income needs, and how your assets work together all play a role. Walking through a few scenarios and seeing how they unfold over time can help bring the right approach into focus.
# # #
Neither Bailard nor any employee of Bailard can give tax or legal advice. Please consult your tax or legal professional for such advice.

Economic brief: AAPL…BA…CAT…
The ticker tape parade got its lofty beginnings high above Wall Street in late October 1886. In what was reportedly a spontaneous act, office workers tossed ticker tape out of their windows to celebrate the dedication of the Statue of Liberty. Pieces of ticker tape floated down amidst fog and rain as a crowd of nearly one million marched down to New York Harbor to watch the unveiling take place on what is now called Liberty Island. President Grover Cleveland spoke, months after tying the knot in the White House, and Lady Liberty was greeted with waving French and American flags, cannon blasts, and ringing church bells.
To date, lower Manhattan has hosted 209 ticker tape parades, according to the Downtown Alliance, most recently in 2024 for the WNBA champion New York Liberty.1 Perhaps the most famous parade through the Canyon of Heroes honored General Dwight D. Eisenhower in June 1945—following Germany’s World War II surrender—but the full list is a fascinating and somewhat eclectic walk through U.S. history, filled with champion athletes, adventurers, veterans, and visiting foreign dignitaries. In 1910, the first officially sanctioned parade was thrown for former president Teddy Roosevelt, upon the occasion of his return from a 15-month African safari!
 Ticker tape is now a vestige of a bygone era, replaced both as a source of confetti and more consequentially as a means of communicating stock prices (via telegraph lines). In the late 1860s, the stock ticker machine revolutionized trading, enabling access to dramatically faster pricing data. It remained the standard for close to a century before being forced into retirement by computers, but its legacy lives on via the tickers (trading symbols) used to buy and sell stocks: the ubiquitous quotes crawling across the screen on CNBC and other financial networks. Commentators still refer to “the tape” when discussing stock prices and a review of the markets might be a “tale of the tape.” Some stocks are perhaps better known by the ticker (GOOGL, for example) than the company name (Alphabet).
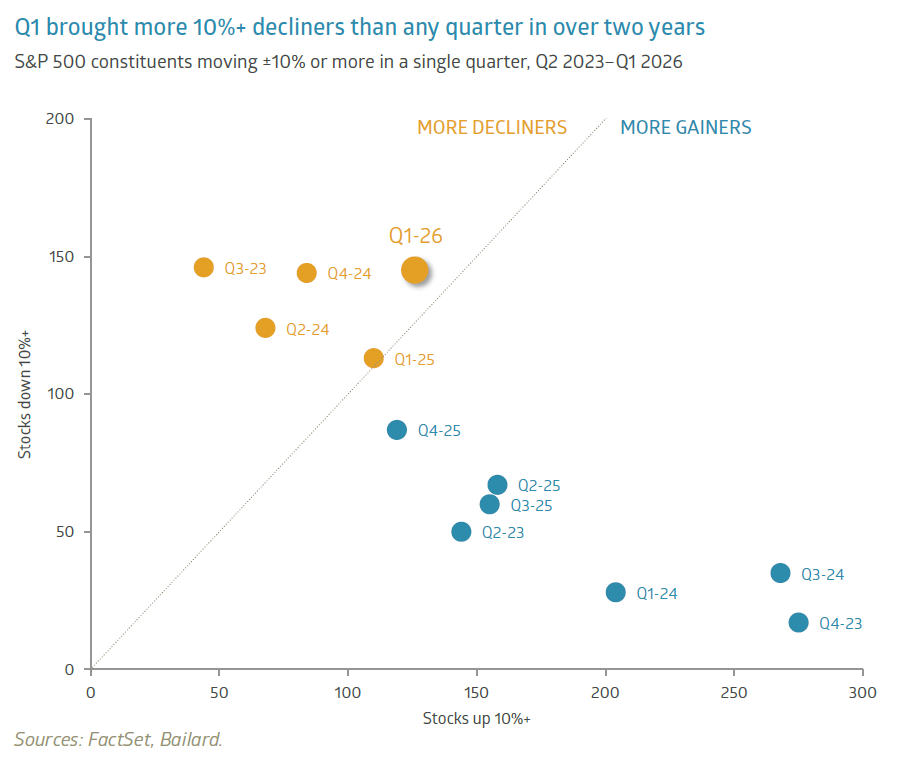
The current crop of Wall Street traders likely shredded some virtual ticker tape in the first quarter of 2026. Volatility picked up and not just the good (upward) kind. Within the Standard & Poor’s (S&P) 500 Index, 145 stocks declined by at least 10% in Q1, the highest level on that metric since 2023’s third quarter. At the other end of the spectrum, 126 stocks moved at least 10% higher, meaning that approximately 54% of the Index’s constituents experienced a 10% or greater price change for the full quarter. Both the Dow Jones Industrial Average (DJIA) and the NASDAQ Composite Index suffered a correction—a 10% decline from a recent peak—and these data points don’t fully capture the day-to-day volatility. In late February, analysts from Barclays PLC noted that single-stock volatility stood at about seven times that of the broader market, the widest divergence in at least 30 years.2 This was prior to the Iran war, in a market environment characterized by rapidly shifting sentiment on how AI will ultimately impact various industries. Lacking many answers on that front, investors rushed for the exits in certain areas (software) while piling into makers of memory chips and other groups perceived as near-term AI beneficiaries.
Straightjacket
Bombing Tehran did not settle the markets. It lit a fuse under commodity prices, sending the price of Brent crude oil soaring as high as $121 per barrel before closing the quarter up 69%. Only a few years removed from a punishing bout with inflation—which saw the Consumer Price Index (CPI) peak at roughly 9% year-over-year growth—markets expressed an immediate distaste for this development. The tape’s antagonistic relationship with elevated crude oil prices is nothing new. This unease seems likely to persist until the supply shock eases. Piper Sandler’s chief investment strategist, Michael Kantrowitz, put it bluntly: “It’s a single-variable market. If oil doesn’t go down, the market won’t go up – period.”3 Following a year in which gold stole the show, so-called black gold is headlining 2026 thus far and threatening to derail the promise of a stable price environment in which the Federal Reserve (the “Fed”) could further reduce its Fed Funds borrowing rate and spur economic growth.
In another echo of the post-pandemic economic landscape, supply disruptions have reemerged, with the potential to clog global growth. The Strait of Hormuz bottleneck affects roughly 25% of the world’s seaborne oil trade and almost 20% of global Liquefied Natural Gas (LNG) exports, according to the International Energy Agency (IEA).4 The impact extends far beyond energy, however. The Middle East plays a key role in supplying fertilizers, sulfur, methanol, helium, aluminum, and other non-oil commodities.5 Tariffs had already scrambled supply chains, but the Strait shutdown is exposing further vulnerabilities. Regarding AI, the Financial Times pointed out: “Investors have committed trillions of dollars to the technology, one of the most power-hungry inventions ever, on the assumption of ample energy supplies and a slick chip production line that can cross more than 70 borders before reaching the final consumer.”6 A prolonged impasse in the Gulf would act as a governor of sorts, limiting speed in a region that is an important gas pedal for the global economy.
Shortages are seemingly everywhere: labor, power, semiconductors…even mineral water? Coca-Cola announced that Topo Chico, its carbonated mineral water brand, won’t be available until later this year. The product is sourced from Monterrey, Mexico where Coca-Cola has encountered issues with the wells. Fed Chair Powell acknowledged in a recent talk at Harvard University that the Fed’s main tool—controlling interest rates—really only has an impact on demand, not supply.7 Thus, monetary policy has its limits in dealing with a supply shock such as the Gulf going offline. Instead, the Fed is focused on monitoring longer-term inflation expectations, which to this point have remained muted. As for actual inflation, the Federal Reserve Bank of Cleveland’s inflation “nowcast” estimates that CPI has moved up to around 3.4% year-over-year growth currently, roughly one percentage point higher than it was in February.8
The replacements
Policymakers also face a thorny task in evaluating the labor markets. The initial months of 2026 have seen a raft of layoff announcements, many of which are AI-related. Notably, Block, Inc. (symbol: XYZ), headquartered in Oakland, CA, announced it would lay off 40% of the company. CEO Jack Dorsey posted to X: “we’re already seeing that the intelligence tools we’re creating and using, paired with smaller and flatter teams, are enabling a new way of working which fundamentally changes what it means to build and run a company, and that’s accelerating rapidly.”9 He was careful to emphasize that the decision was not made because the company is struggling, citing growing profits and profitability. Dorsey also predicted via a separate letter to shareholders that within the next year a majority of companies will reach the same conclusion and make similar structural changes. Minnesota-based logistics company C.H. Robinson has reduced its headcount by approximately 31% since 2022, replacing humans with hundreds of agentic AI agents that help process freight orders.10 The company says productivity has improved 40% over this timeframe.
Plenty of other companies have signaled intentions to significantly slash the workforce: Meta Platforms, Amazon, Oracle, and HSBC are just some of the downsizers. In January, U.S. employers announced more than 108,000 layoffs, the highest January level since 2009.11 Admittedly, certain industries have a bigger bullseye for the AI transition, and this trend hasn’t (yet) materially impacted aggregate labor statistics. It does, however, pose some hard societal questions in the longer term. A structurally higher unemployment rate could also weigh on consumer demand. In the meantime, corporations can benefit from reduced labor costs and downtime. The Fed recognized the potential for productivity gains in its latest “Summary of Economic Projections” by increasing the median estimate of longer-run real Gross Domestic Product (GDP) growth to +2.0% from +1.8% previously.
 Higher turnover isn’t just affecting the low-end worker. According to The Wall Street Journal, roughly one Chief Executive Officer (CEO) in nine was replaced in 2025 across 1,500 of the largest publicly traded companies.12 That is the highest rate since at least 2010. To borrow from William Shakespeare: “Uneasy lies the head that wears a crown.” The heightened economic policy uncertainty could be a motivating factor for companies, along with the shifting sands caused by AI. Geopolitical concerns only add to a complicated decision matrix for corporate boards, particularly for firms with a global footprint.
Equity markets have demonstrated resilience in the face of the volatility revival. A still healthy outlook for corporate profits deserves credit, with S&P 500 operating earnings per share growth projected at nearly 18% for 2026. If energy prices remain elevated, increased caution may be warranted, but the markets—like the Fed—are taking a wait-and-see approach overall despite the choppy waters. Wall Street is used to the tumult, after all, conditioned by many decades of upheaval and the occasional ticker tape parade to soften the blows.
# # #
1. “History of New York City’s Ticker-Tape Parades,” www.downtownny.com.
2. “Listless US Stock Market Masks Record Volatility Beneath Surface,” www.bloomberg.com, 2/21/2026.
3. “Wall Street Is Finishing the Worst Quarter for Stocks in Four Years,” www.wsj.com, 3/30/2026.
4. “Strait of Hormuz Factsheet,” www.iea.org, February 2026.
5. “The Strait of Hormuz crisis affects more than just oil. Here are 9 other commodities,” www.weforum.org, 4/1/2026.
6. “How the Iran war could derail the AI boom,” www.ft.com, 3/22/2026.
7. “Powell Says Private Credit Doesn’t Pose Systemic Risk,” www.bloomberg.com, 3/30/2026.
8. “Inflation Nowcasting,” www.clevelandfed.org, 4/3/2026.
9. “In a 600-word X post, Jack Dorsey justifies his decision to lay off 40% of Block’s workforce,” www.fastcompany.com, 2/27/2026.
10. “C.H. Robinson trims high-level managers as part of AI-driven cuts,” www.startribune.com, 3/30/2026.
11. “Layoffs in January were the highest to start a year since 2009, Challenger says,” www.cnbc.com, 2/5/2026.
12. “Companies Are Replacing CEOs in Record Numbers – and They’re Getting Younger,” www.wsj.com, 2/15/2026.
Past performance is no indication of future results. All investments involve the risk of loss. Please see the last page for important disclosures as well as index and category definitions.

2026 state estate & inheritance tax overview
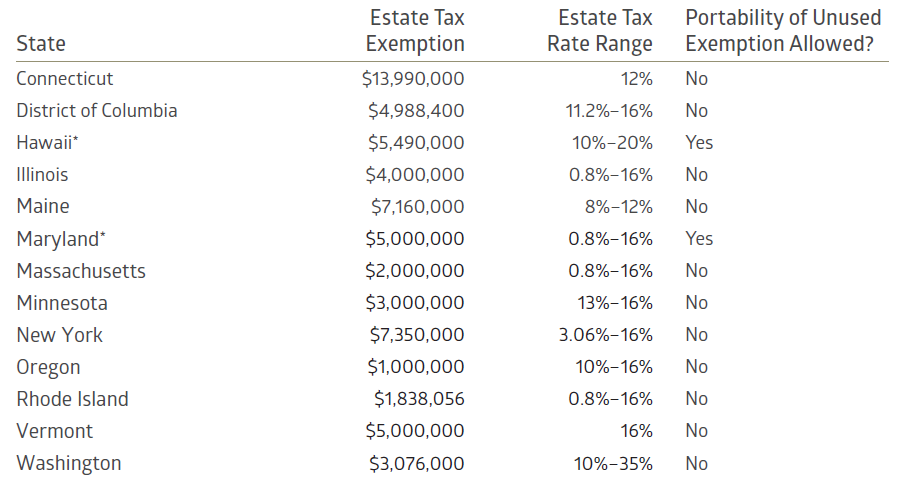
Several states impose estate or inheritance taxes at thresholds well below the federal exemption. Currently, 13 jurisdictions impose an estate tax, five states impose an inheritance tax, and Maryland imposes both. Because state rules and exemption levels change periodically, they should be confirmed before making planning decisions.
Estate tax states
Inheritance tax states
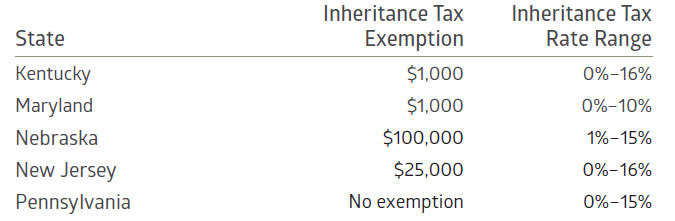
Inheritance tax rates and exemptions often vary depending on the beneficiary’s relationship to the decedent. Spouses are typically exempt, and many states provide favorable treatment for children or other lineal descendants, while higher rates may apply to extended family members or unrelated beneficiaries.
# # #
This summary is intended as a general reference point to support planning discussions. Exemption levels, tax rates, and rules may change periodically and should be verified before implementing planning strategies.