
The Rise of B Corps and Benefit Corporations
Focusing on the rise of B Corps and Benefit Corporations, Blaine Townsend, CIMC®, CIMA® (Director of Sustainable, Responsible & Impact Investing) sheds light on the shift towards a business paradigm that values employee, community, and environmental well-being alongside shareholder returns.
The role of corporations in society has always been hotly debated. In fact, Thomas Jefferson warned of the “aristocracy of our monied corporations” a century before the Supreme Court granted Southern Pacific Railroad (and, by extension, all corporations) the same rights as a “person.” Today, large companies drive almost every aspect of American life—from environmental outcomes to political influence. But smaller companies also play a huge role in the U.S. economy and labor force. With that outsized influence comes the opportunity to positively impact shareholders, employees, communities, and the planet. Since 2006, the Certified B Corporation™ framework has set out to guide (mostly smaller) companies in doing just that.
B Corps and Benefit Corporations: Understanding the Difference
The Certified B Corp is a manifestation of a broader movement supporting the idea of the “Benefit Corporation.” In short, a for-profit company that works for shareholders, but also makes an explicit commitment to have a positive impact on employees and other stakeholders. The common denominator between a B Corp™ and Benefit Corporation is the shared belief that maximizing profit is not the sole mission of a business.
There is a distinction, however: The Benefit Corporation is a legal status offered in 41 U.S. states and the District of Columbia. It is akin to a C Corp or LLC. A B Corp is a third-party certification that has been granted by the non-profit organization B Lab™. There is a lot of overlap between the two, and in both cases, companies are making it clear the fiduciary duty of its officers and directors also encompasses employees and other stakeholders.
In any state where the Benefit Corporation legal charter exists (like California), a Certified B Corp must also take the step to change their legal designation to a Benefit Corporation as part of the certification. While clothing/gear brand Patagonia is perhaps the best-known B Corp, Bailard, Inc. is one of the newest, having achieved its B Corp Certification in 2023. There are currently nearly 8,000 B Corps in over 90 countries. The movement is growing.
Small Businesses, Big Impact
A company can incorporate as a Benefit Corporation at its outset, or convert later by amending its governing documents and meeting certain legal requirements. Historically, very few publicly listed companies have incorporated as Benefit Corporations (perhaps as few as three). Most, like Bailard, are smaller, privately held companies. That is not a deficit in the power of the B Corp movement, however.
Despite the dominance of large corporations, smaller companies are pivotal in the U.S. economy and its society. According to the Small Business Association (SBA), businesses with fewer than 500 employees account for 99.7% of all U.S. companies. They employ over 40% of domestic workers and have generated over 60% of net new jobs in the U.S. since 1995. Small businesses account for 44% of all U.S. economic activity.
The Power of Certification
In fact, the power of smaller companies to reshape the global economy for a broader set of stakeholders was a foundational piece of B Lab’s founding philosophy. Although the B Corp process is industry-agnostic, B Lab touts that companies in 162 industries have been certified, often in sectors that need it most. An academic study found a positive correlation between the number of B Corps in an industry and the prevalence of “shareholder-centric” policies within that industry, such as high layoff rates or significant pay disparities. The poorer these metrics are, the more likely it is that companies within the industry will pursue B Corp Certification.
For companies already aligned with the B Corp mission, certification is often more about publicly affirming what has been a private commitment to specific values. For Bailard, undergoing the certification process was more like looking in a mirror than looking at a map. As an independent, majority employee-owned, woman-led, majority women- and minority-owned, and community-focused company, the B Corp Certification was an affirmation of the company’s long-standing core values. However, the process does require a willingness to be evaluated publicly. It also provides a structure to codify corporate policies. The process to get certified is not easy. According to B Lab, only 40% of certification applications are successful, underscoring the principle that a B Corp must genuinely “walk the talk.”
Once committed, B Corps have shown a 96% retention rate. However, even for those choosing not to fully complete the certification, B Lab can provide resources. B Lab reported that over 240,000 companies used its assessment tool, which helps companies look at their own practices. At the center of the process is the B Lab Impact Assessment, which requires companies to score at least 80 out of 200 points to be certified, covering Governance, Workers, Community, Environment, and Customers. A fee based on company revenue is paid to B Lab to go through the process. Gathering all the required information and providing the documentation can be daunting and may take a full year.
Demonstrating Real Benefits
Evidence suggests the values attributed to being a Benefit Corporation strengthen a business. For example, during the challenging year of 2020, only 4.5% of B Corps failed, compared to 12.5% of American businesses overall. B Corps also report higher employee retention rates and a competitive edge in recruiting. Additionally, there is a growing number of key professional service firms in the space that want to work with other B Corps. Numerous studies have shown that consumers are very interested in the values behind the brands they buy or the companies they hire. To that end, B Lab provides a search engine for finding B Corps for consumers or business networking.
In an era of “greenwashing,” B Corps have completed a third-party assessment of key employee and sustainability metrics. Being a B Corp gives more gravity to the expressed values of a firm. Multiple studies show that Millennial and Gen Z employees—who currently make up 50% of the U.S. workforce—consider a company’s values when making purchases or choosing where to work.
A Commitment Beyond Profit
The rise of B Corps and Benefit Corporations signifies a shift in corporate philosophy, as it clearly reflects a commitment to specific values. But it is also more than that. It is a commitment to the idea that building stronger ties with employees and more sustainable business practices is the right way to conduct business going forward. Businesses that treat their employees poorly, or ignore environmental or reputational risks, are seldom the backbone of the community or industry outperformers. Nobel Prize-winning economic professor Robert Shiller summed it up well: “The B Corp movement is, to me, a product of a general improvement in our understanding of economic behavior. Through greater appreciation of the real motives that drive and excite people, B Corporations provide a significant new opportunity for investors. I think they could make more profits than any other types of companies….”
This paradigm shift towards more socially responsible and sustainable business practices is not just a trend; it’s the future of business. B Corps and Benefit Corporations are leading the way, proving that success in business can also mean success for shareholders, employees, and society more broadly.
1 The state of Delaware uses the term Public-Benefit Corporation (PCB) instead of Benefit Corporation.
2 https://www.forbes.com/sites/forbesbusinesscouncil/2022/03/25/how-small-businesses-drive-the-american-economy/?sh=2cd4a0304169
3 https://hbr.org/2016/06/why-companies-are-becoming-b-corporations
4 https://www.inc.com/ali-donaldson/why-a-record-number-of-business-owners-are-embracing-b-corps.html
5 Ibid.
6 https://www.federalreserve.gov/econres/feds/files/2020089r1pap.pdf
Bonds Are Back
Jeremy Wager-Smith, Fixed Income Portfolio Associate, examines the dynamic shifts and key trends that shaped the bond market in 2023.
A Dynamic Year
Interest rate volatility defined 2023 for fixed income markets. Markets skewed more reactionary than anticipatory, as the bond market digested a stronger-than-expected U.S. economy, an active Federal Reserve (Fed), regional bank turmoil, and a mountain of U.S. Treasury issuance.
The higher-for-longer interest rate narrative took hold by mid-year, as initial expectations of summer rate cuts faded, and a resilient U.S. labor market came into focus. Fed Chair Jerome Powell made clear the Fed’s commitment to bring inflation down to its 2% target as the Federal Open Market Committee (FOMC) elected to raise the Fed Funds target rate four times throughout the year, with the last hike occurring in July. This marked the eleventh interest rate hike of this cycle and brought the Fed Funds target rate to 5.50%, a level not seen since 2001. As expected, ultra-short yields rose in response to continued hikes and the Fed’s hawkish talk. 10-year U.S. Treasury bond yields peaked a bit later in mid-October at 4.99%—a level not seen since July of 2007—before dropping back down to close the year nearly unchanged. Looking forward to 2024, our outlook for bonds remains positive. We expect interest rate volatility to remain high, but at a more subdued level than in 2023.
A Look Ahead at Federal Reserve & Monetary Policy
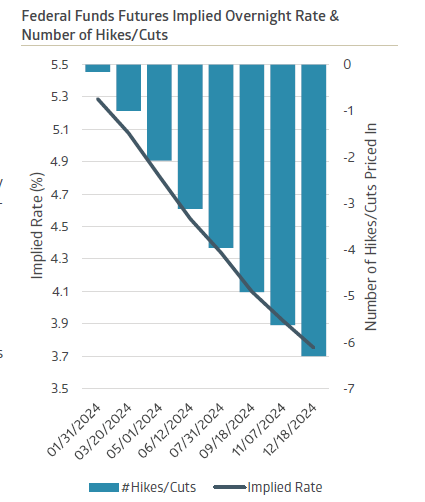
In our view, markets are pricing in an excessive number of rate cuts in 2024 and, thus, a more dovish Fed than we anticipate. CME Fed Funds futures (a series of derivatives used to hedge short-term interest rates) are pricing in a 2024-year-end effective Fed Funds rate of 3.75%. This level implies over 150 basis points of rate cuts by year-end, with cuts beginning in March and continuing throughout the year.
Absent a recession or deflationary shock, we expect rate cuts to begin later in the year, and, cumulatively, to be fewer than what markets are pricing in. With the blistering rally in intermediate- to longer-dated Treasuries through year-end, markets have partially eased financial conditions for the Fed. The Goldman Sachs Financial Conditions Index—which uses borrowing costs, equity ratios, and credit spreads to gauge financial tightness—concluded 2023 at its lowest year-to-date level after reaching a year-to-date peak in late October.
Meanwhile, headline inflation is continuing its choppy decline from last year’s decade high of 9.1% and, as seen in December’s seasonally-adjusted unemployment rate of 3.7%, the U.S. labor market remains resilient. This still-strong U.S. economic picture and favorable financial environment, coupled with the Fed’s tendency to do too little too late, suggests that broad-based financial distress would need to accelerate dramatically to warrant the significant easing of monetary policy expected by markets in 2024.
Yield Curve Inversion Continues
The yield curve remains inverted, but to a lesser degree than a year ago. Often cited as a harbinger of economic pain to come, yield curve inversion occurs when shorter-term U.S. Treasury bonds outyield longer-term U.S. Treasury bonds. The most widely adopted measure of yield curve inversion is the spread, or difference in yield, between 10-year and 2-year U.S. Treasury bonds. This spread closed 2023 at -37 basis points, after beginning the year at a wider level of -56 basis points. With our expectation that the Fed will begin to cut the Fed Funds rate by mid-year, we anticipate this spread narrowing throughout the year as the short end of the yield curve retreats.
Municipal Credit Expectations
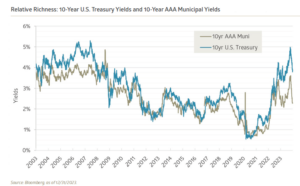
Municipal bonds rebounded in 2023 after a difficult 2022, as the Bloomberg 1-15 Year Municipal Bond Index saw a healthy uptick of 5.26%. Strong demand coupled with slightly lower municipal issuance on a year-over-year basis contributed to municipals ending 2023 at their richest levels in 40 years relative to Treasury bonds.
The credit profile of many municipal issuers experienced significant tailwinds coming out of the pandemic. Propelled by strong tax receipts and ample federal assistance, municipalities bolstered their balance sheets and established rainy-day funds. Since then, the combination of higher debt-servicing costs, rising operating expenses, and markedly weaker-than-expected tax revenues will most likely result in weaker municipal credit conditions in 2024. To insulate portfolios from much of this expected deterioration, taxable investors could stand to gain by favoring higher quality credits and resilient revenue sources.
We continue to closely monitor the State of California’s fiscal situation. A wealth exodus and absence of federal pandemic stimulus, combined with an overreliance on cyclical personal income tax revenues and optimistic revenue forecasts, have left the state facing budget deficits for fiscal years 2023 and 2024. Although the state does face fiscal difficulties, with its AA2/AA- rating we remain comfortable holding the state credit. In our view, demand for all California in-state bonds should remain high as state tax rates create demand for double-tax exempt income.

The Trajectory of Corporate Bonds
Aggregate and corporate bond indices provided positive returns in 2023, with the Bloomberg U.S. Aggregate Bond Index increasing 5.53% and the ICE Bank of America 1-10 Year Corporate Bond Index posting a 7.33% gain. Investment grade corporate spreads, or the pickup in yield between a corporate bond and a comparable maturity US Treasury bond, narrowed in 2023. If a hard economic landing or recession can be avoided, we anticipate spreads for high quality bonds staying relatively tight and rangebound throughout the year even with an expected increase in 2024 investment grade issuance.
Regarding industry-specific expectations, we continue to steer clear of regional banks due to ongoing concerns about the impact of held-to-maturity securities on their balance sheets. Instead, we prefer larger, systemically important financial institutions. For tax exempt investors, we have a continued preference for a higher allocation in corporate and mortgage-backed securities relative to standard aggregate benchmarks. We believe that the current, attractive level of interest rates offers a buffer against possible weakness in the stock market.
1 Bloomberg – FFG4 COMB Comdty
2 Bureau of Labor Statistics
3 Yield Curve – Plotted series US Treasury bond yields. Organized from shortest to longest time to maturity.
4 Bloomberg
5 Bloomberg YTDMTOT Index
6 “S&P Downgrades California Bond Outlook Amid Budget Crunch” – The Center Square
7 Investment Grade – Corporate bonds rated Ba1/BB+ or higher
Economic Brief: The Abominable No-Man
From the legacies of iconic investors to the dynamic 2023 markets, Jon Manchester, CFA, CFP® (Senior Vice President, Chief Strategist, Wealth Management, and Portfolio Manager, Sustainable, Responsible and Impact Investing) presents an insightful perspective on the economic climate, aided by the witticisms of Charlie Munger.
 Legendary investor Charlie Munger passed away in late November, just a month shy of reaching the century mark. For 45 years, Munger served as the witty and characteristically caustic partner to Warren Buffett at Berkshire Hathaway. He was a surefire sound bite, adept at delivering zingers with a wry smile while on stage at Berkshire’s annual “Woodstock for Capitalists” shareholder meetings in his hometown of Omaha, Nebraska. Sometimes, he was funny: “Learning from other people’s mistakes is much more pleasant.” Often, he was insightful: “People calculate too much and think too little.” Undeniably, he was practical: “Don’t bail away in a sinking boat if you can swim to one that is seaworthy.” The vast collection of “Mungerisms” captures his concise yet astute speaking style, and lent Munger cult hero status amongst the investment crowd. Long before Twitter’s original 140-character limit, Munger endorsed brevity. In Berkshire’s 2022 letter to shareholders, Buffett acknowledged that “what it takes me a page to explain, (Charlie) sums up in a sentence.”
Munger liked to keep things simple. In fact, his favorite tool to tackle thorny issues was the humble checklist: “I’m a great believer in solving hard problems by using a checklist. You need to get all the likely and unlikely answers before you; otherwise, it’s easy to miss something important.” The checklist method was no guarantee of cracking the case, however. Munger said that if they lacked special insight into a company, they would set the investment aside as “too tough” and move on. Acknowledging one’s limitations is an important trait, something Munger referred to as staying within their circle of competence. However, both Buffett and Munger admitted they missed their share of investment opportunities this way, notably, in the technology sector. Further, the duo faulted themselves for “mistakes of omission,” where they failed to invest in a company such as Wal-Mart despite having a solid understanding of the business. Those called strikes didn’t hurt too badly: a $1,000 investment in Berkshire Hathaway made at the end of 1978 was worth nearly $3 million by year-end 2022.
It could be said that the hallowed performance track record assembled by the Oracles of Omaha was one percent inspiration, and ninety-nine percent contemplation. Both Munger and Buffett spent countless hours reading and thinking, and comparatively few hours taking action. Buffett reportedly playfully referred to Munger as “The Abominable No-Man” because Munger so frequently turned down potential investments. When they did decide to invest, it was typically in a big way, either buying a business outright or taking a significant stake in the company. Berkshire spent $1.3 billion buying shares of Coca-Cola several decades ago, and in 2022 received dividend payments of $704 million on their shares, which had by then appreciated to a $25 billion market value. The annual dividend yield calculated on their original cost had ballooned to a gaudy 54% – a testament to time, patience, and the power of dividend growth.
Checking it Twice
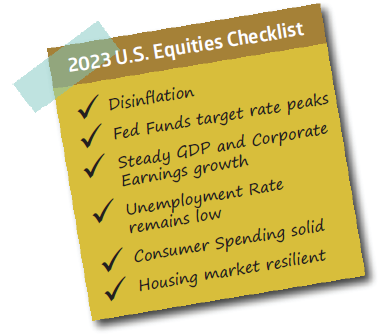
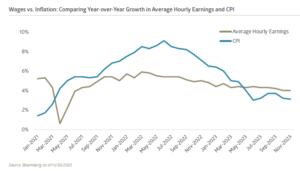
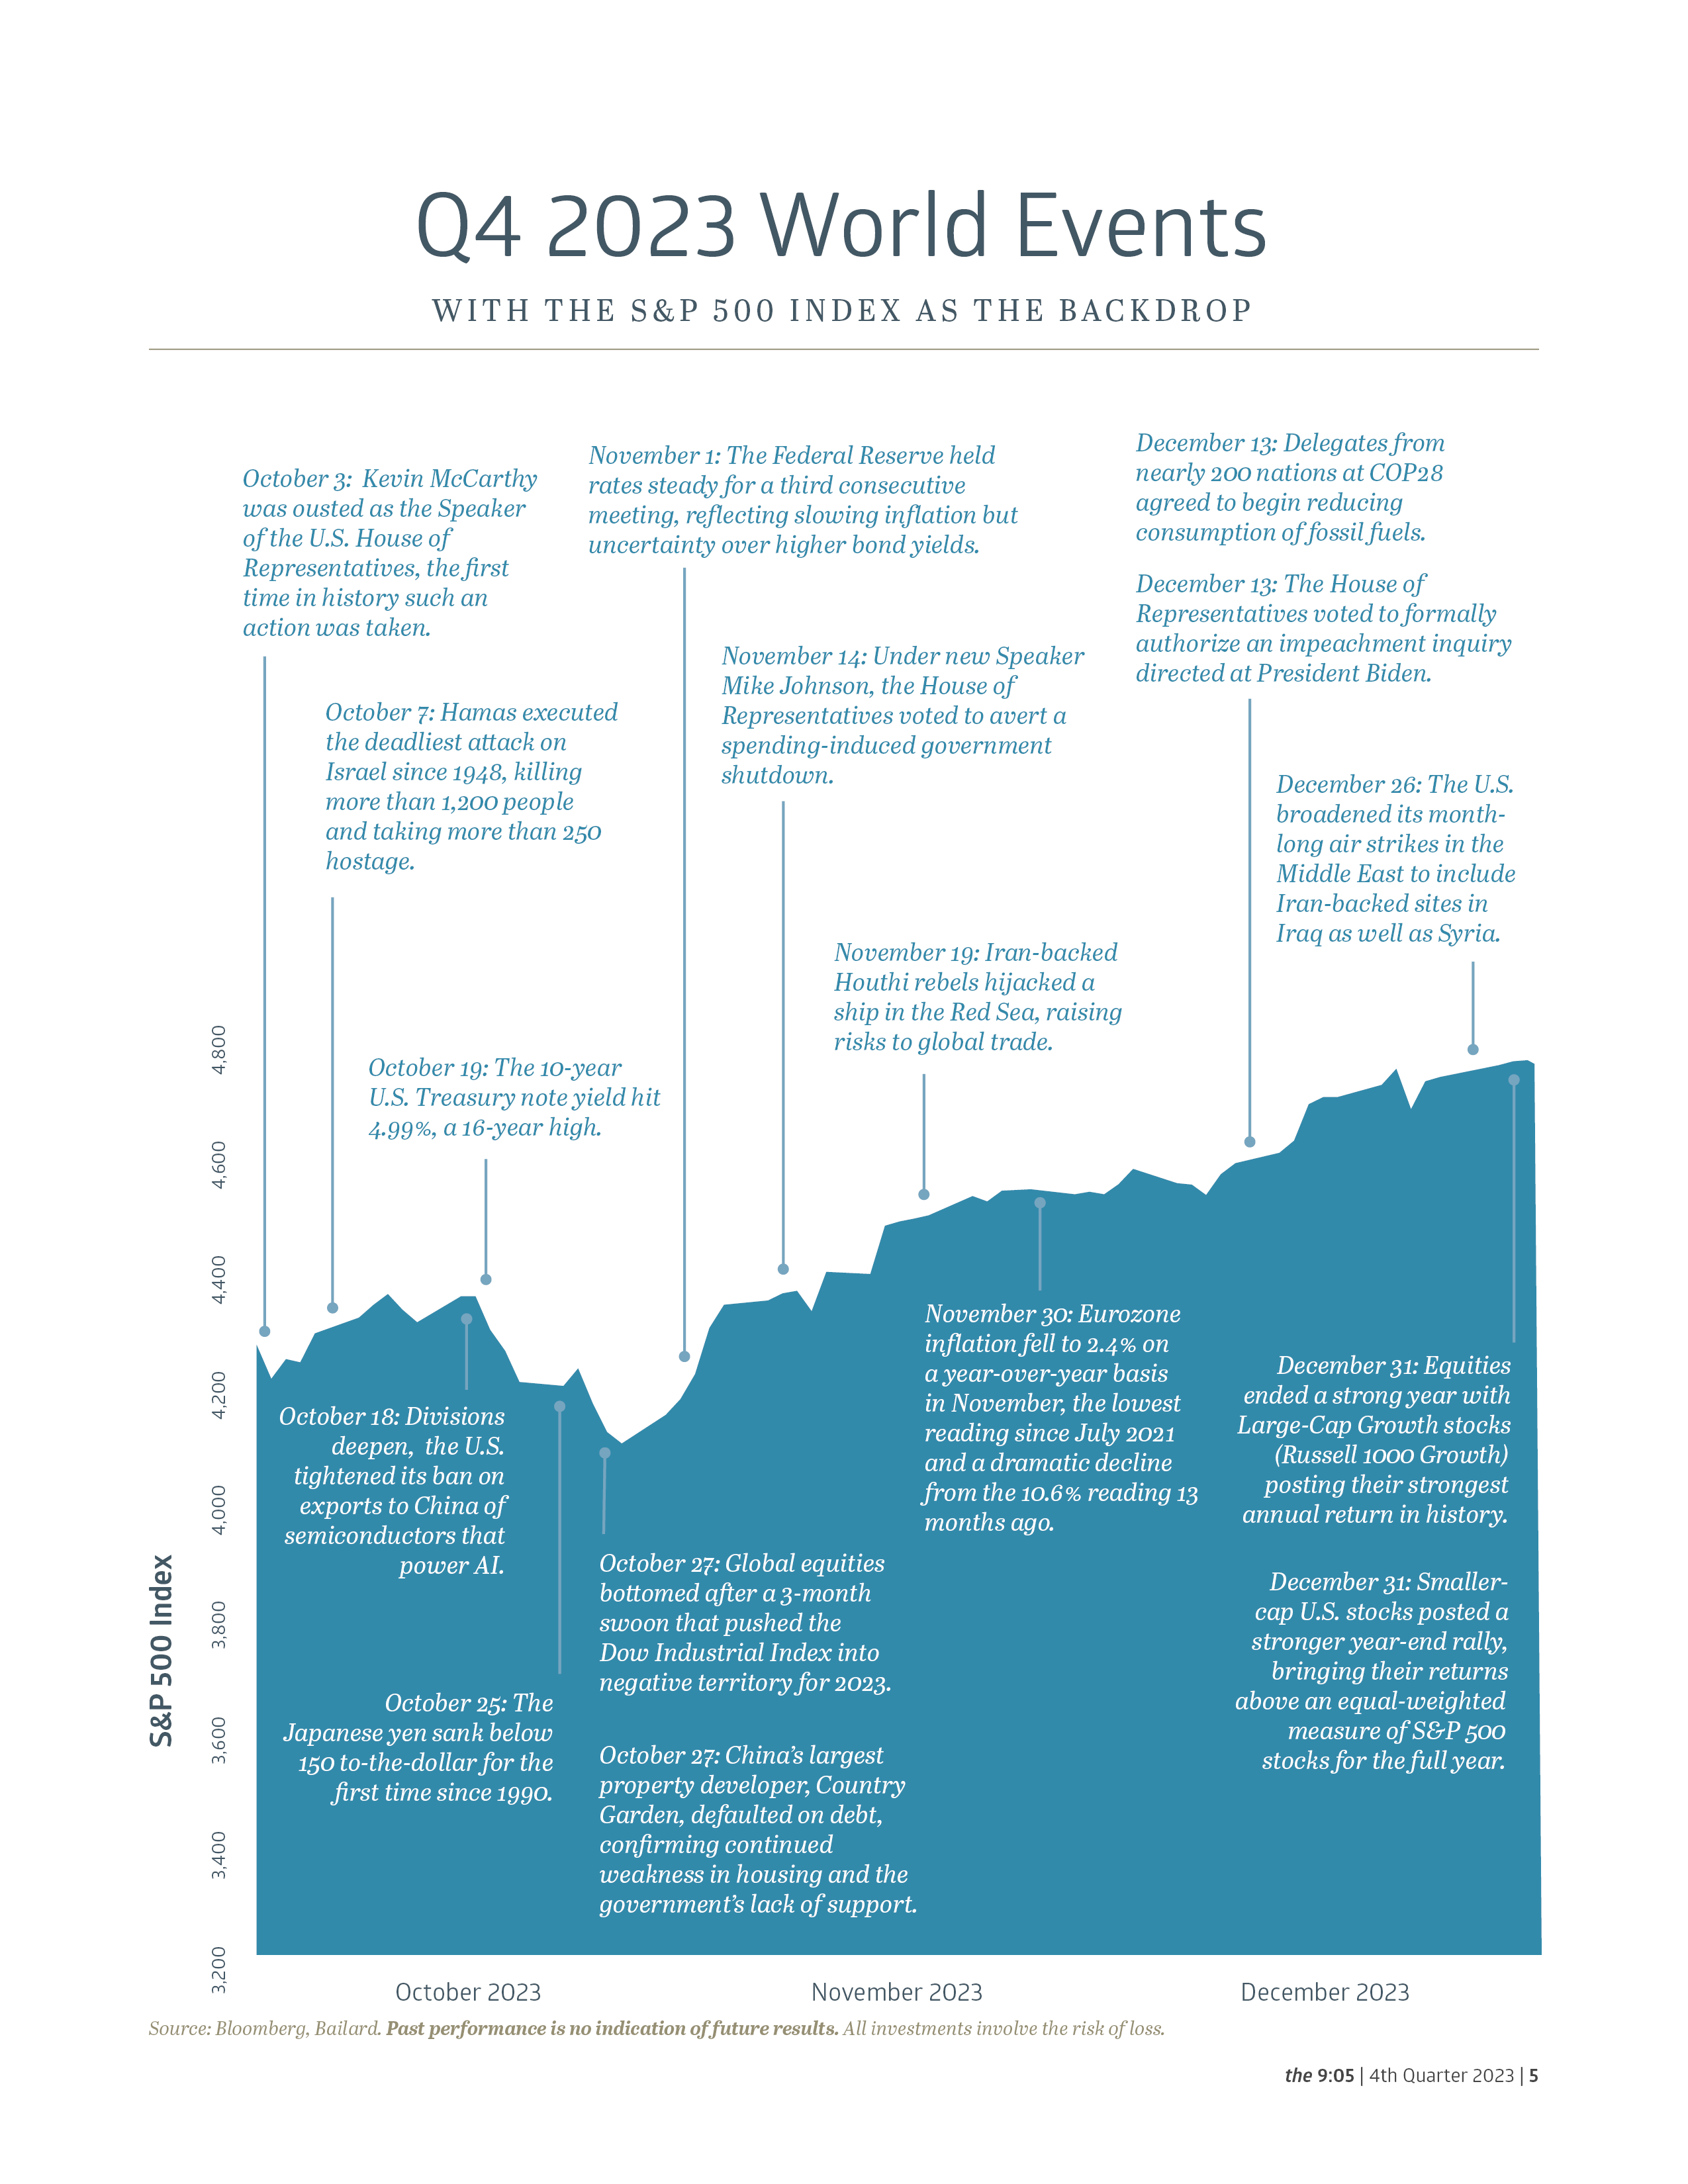
In honor of Charlie Munger, a simple checklist for U.S. equity investors in 2023 is presented at right. Essentially every item broke in favor of equities. First and foremost: inflation. The trend couldn’t have been much more favorable on that front. The Consumer Price Index (CPI) increased a worrisome 6.5% year-over-year in 2022, peaking at a 40-year-high of 9.1% mid-year. By November 2023, the CPI’s growth rate had slowed to 3.1%, within striking distance of the Federal Reserve’s 2% target.
Importantly for consumers (and politicians), the headliners of food and energy prices have improved significantly. Gasoline prices declined nearly 9% year-over-year as of November, while food prices rose just 2.9%. A surge in domestic oil supply helped to dampen energy prices. In fact, U.S. oil production established a new worldwide record of 13.2 million barrels per day in November, surpassing the previous highwater mark set by the U.S. in early 2020. Domestic output—led by shale oil drillers in the Permian Basin of Texas and New Mexico—is so strong that we are exporting as much crude oil, refined products, and natural gas liquids as Saudi Arabia or Russia produces.
 The sharp deceleration in the rate of inflation enabled Fed officials at their December meeting to project three Fed Funds rate cuts in 2024 and four more in 2025, suggesting we may have seen the end of the Fed’s rate hiking campaign. This had visions of a soft landing dancing in investor’s heads, that magical scenario in which the Fed is able to quell inflation via higher borrowing rates without incurring a recession. Economist Paul Krugman went so far as to say, “So far, this has been ‘immaculate disinflation,’ requiring neither a recession nor a large rise in unemployment.” While communicating the Fed’s rate decision, chairman Jerome Powell noted that U.S. Gross Domestic Product (GDP) was on track to expand around 2.5% (inflation-adjusted) for 2023 as a whole. As for corporate earnings, the Standard & Poor’s 500 Index is estimated to have generated 8% to 9% growth per share in 2023. In both cases, that growth lands squarely in the sweet spot, neither overheated nor ice cold.
In retrospect, the “recession that wasn’t” in 2023 failed to materialize primarily due to basic economic bedrocks: the employment and housing markets. Higher interest rates and still elevated inflation did pose challenges, as anticipated, but consumer spending didn’t wither in the face of those headwinds. Personal Consumption Expenditures (PCE) rose 2.7% year-over-year in November, a modest acceleration from the 2% to 2.5% growth range the series registered for much of the year. Consumers enjoyed the stability of a tight job market, with unemployment at just 3.7% in November, and average hourly earnings up 4%, topping the inflation rate. Further, housing prices have absorbed higher mortgage rates without too much trouble. Transactions are down: monthly existing home sales hit a 13-year low in October. Low inventory has aided prices, however. The S&P CoreLogic Case-Shiller National Home Price Index reflected a 4.8% year-over-year gain in October, a ninth-consecutive month of gains and establishing a new record high. The wealth effect theory—that people spend more as the value of their assets rises—seems intact.
Revenge Spend
To paraphrase music superstar Bruno Mars, consumers are dangerous with some money in their pockets. According to a Bloomberg article, Americans continued to splurge in 2023, shelling out for revenge travel, Taylor Swift tickets, and expensive restaurant meals. A lot of it was funded with debt, the article cautions, pushing credit card balances up to $1.08 trillion prior to the holiday season. Delinquency rates are only modestly above pre-pandemic levels, but the average annual percentage rate (APR) has spiked north of 20%, the highest on record. Some have identified a “silent recession” with millions of people struggling to keep up with student loans, car loans, pricey groceries, and higher housing costs. This doesn’t bode particularly well for consumer spending in 2024, although if the current trend of softening interest rates continues the impact could be dampened.
The term “revenge spending” has been around for several years and is commonly defined as elevated spending in the aftermath of a challenging event or time, such as the pandemic. Carnival Corporation has been a somewhat surprising beneficiary of this phenomenon. An early casualty during the pandemic, for obvious reasons, Carnival pulled in record revenues of $21.6 billion in 2023 and has already booked two-thirds of their occupancy for 2024 at “considerably higher prices.” Carnival noted they captured over 3.5 million new-to-cruise guests during 2023. The stock remains well below its pre-pandemic level, despite a 132% rally in 2023, with the company working to pay down its bloated debt load. After peaking north of $36 billion, Carnival has reduced its long-term debt to just above $30 billion, still exceeding its market capitalization of $23 billion. Although Carnival’s debt remains junk-rated by S&P Global, it did receive an upgrade in December by two notches to BB-. The pandemic’s reverberations are still being felt economically, both positively and negatively.
 For equity investors, the banner year for U.S. large-cap indices begs the question of how much upside remains at present. The S&P 500 Index concluded 2023 trading at approximately 22x estimated trailing earnings per share, and nearly 20x estimated 2024 earnings. Valuations have been pushed higher in particular by the incredible surge in tech stocks. According to Bernstein Research, 18% of tech stocks now trade at greater than 10x revenues versus a historical average of 6%. At its year-end 2023 level, the S&P 500 arguably has already discounted the positive impact of lower rates in the year ahead, plus the assumed S&P 500 earnings growth of roughly 13%. That said, markets perpetually look forward and will attempt to start pricing in 2025 assumptions as the year progresses.
If you listen to prominent economist and strategist Ed Yardeni, there is plenty of upside left. His eponymous research firm believes we might be looking at a “Roaring 2020s” scenario, buoyed by wealthy and liquid households, a strong labor market, productivity gains from the ongoing high-tech revolution, and receding inflation, among other factors. An optimistic take, perhaps, but its longer-term focus would be endorsed by Charlie Munger. In his words: “Warren and I don’t focus on the froth of the market. We seek out good long-term investments and stubbornly hold them for a long time.” That approach seemed to work out okay.
1 Griffin, Tren. “Charlie Munger: The Complete Investor.” 2015. p. 104
2 Griffin, Tren. “Charlie Munger: The Complete Investor.” 2015. p. 46
3 Berkshire Hathaway 2022 shareholder letter, www.berkshirehathaway.com
4 Griffin, Tren. “Charlie Munger: The Complete Investor.” 2015. p. 6
5 “The United States is producing more oil than any country in history,” www.cnn.com, 12/19/2023
6 “Inflation, disinflation and vibeflation,” www.nytimes.com, 12/5/2023
7 “’Revenge Spending’ Drives US Credit Card Debt Past $1 Trillion,” www.bloomberg.com, 12/22/2023
8 “Carnival Corporation & PLC Reports Record Fourth Quarter And Full Year Revenues With Continued Strong Bookings And Earnings Momentum,”
www.carnivalcorp.com/investor relations, 12/21/2023
9 “The $19 Trillion Question – What to do with Tech in 2024?”, www.bernsteinresearch.com, 12/18/2023
10 “Ed Yardeni: 12 reasons stock investors will see the S&P 500 hit 5,400 in 2024,” www.marketwatch.com, 12/27/2023
11 Berkshire Hathaway 2022 shareholder letter, www.berkshirehathaway.com

Economic Brief: High Yields and Hard Lessons
Against the backdrop of rising interest rates, this quarter’s economic perspective from Jon Manchester, CFA, CFP® (Senior Vice President, Chief Strategist – Wealth Management, and Portfolio Manager – Sustainable, Responsible and Impact Investing) delves into the intricate balance between financial stability and market volatility.
It looked good on paper. Almost any investment yield does, when interest rates are close to zero. The math gets progressively less favorable when borrowing costs normalize. Just ask investors in Atlanta-based Newell Brands, which stables Rubbermaid, Sharpie, Graco, Coleman, and other well-known brands. As 2023 began, the stock offered an enticing 7% dividend yield. For those unable to resist the siren call, the yield turned out too good to be true. By the end of April, Newell’s stock price was down 7% year-to-date, effectively wiping out the indicated annual yield. Then in mid-May, Newell issued a press release announcing the quarterly dividend would be slashed to $0.07 per share from $0.23 previously. According to the company, the dividend “right-sizing” would allow Newell to de-leverage the balance sheet faster, plus fund supply chain consolidation efforts and provide greater financial flexibility overall. The roughly 70% dividend cut sent the stock price tumbling further, and by the end of the third quarter shareholders were left lamenting a -29% total return for 2023 thus far.
As a young man from Northern Minnesota named Bob Dylan once sang, the times they are a-changin’. In July, the Federal Reserve (the “Fed’) hiked the Fed Funds target range to 5.25% to 5.50%, the eleventh tightening in a 17-month stretch. This has intentionally poured cold water on capital markets activity, and therein lies a problem for companies such as Newell Brands who have been more heavily reliant on external financing.
 In 2016, Newell splashed out $15 billion to merge with Jarden Corporation, a deal that more than quadrupled Newell’s long-term debt load to over $12 billion. It eventually resulted in a junk credit rating at Standard & Poor’s for Newell, which meant higher borrowing costs. Following a challenging 2022 from a cash flow standpoint, and with a hawkish Fed taking rates higher, Newell had to face reality and prioritize paying down debt. In attempting to both grow the business and keep income-focused shareholders satisfied, Newell realized it could no longer serve both masters.
This cautionary tale is another reminder that chasing high yield stocks can be a short-sighted strategy, particularly when a company is overly reliant on cheap financing to make it all work. We should be careful about reading too much into one company’s travails, but it seems likely other highly-indebted companies will encounter similar struggles. With the Zero Interest Rate Policy (ZIRP) days quickly fading from memory, the macroeconomic waters may not be quite as inviting in the near-term. Along those lines, Strategas Research chief economist Don Rissmiller has compared restrictive monetary policy to (collectively) holding our breath under water, and at risk of stating the obvious, he notes the longer we do so the more dangerous.1 The U.S. economy appears adequately buoyant at present, but it is reasonable to fret that the Fed’s aggressive battle against inflation—which is not yet mission accomplished—may cause more collateral damage.
Until Something Breaks
Longer-dated U.S. Treasury yields have risen in part due to greater acceptance of the “higher for longer” narrative. By that meaning the Federal Reserve may plateau the Fed Funds target rate at a restrictive level for a longer period of time than originally anticipated. First, though, the Fed needs to stop hiking, and in late September its “dot plot” indicated that 12 of 19 officials favored another rate increase this year. The Fed’s median projection for the year-end 2024 Fed Funds target rate was 5.1%, only slightly below the current level, and up from 4.6% previously. It’s worth acknowledging that only recently has the Fed Funds target rate actually exceeded the inflation rate. That crossover occurred in June, using the Consumer Price Index (CPI) excluding Food & Energy. For inflation to be truly quieted, the Fed will likely want to see prices remain below the policy rate for an extended timeframe.
Higher rates typically portend trouble for companies with weaker balance sheets. Firms that aggressively borrowed during the funny money years now encounter a new landscape, whether they need to refinance debt or borrow new funds. Equity markets have already started reflecting this in prices. One way to measure financial leverage is to look at a company’s net debt-to-EBITDA (earnings before interest, taxes, depreciation, and amortization) ratio. On a year-to-date basis through September, the S&P 500 companies in the highest decile on that metric produced a -6.6% median total return.2 Dispersion was wide within that decile, with cruise line stocks soaring while Dish Network and other heavily indebted names mightily struggled. The bottom decile—those companies with low debt in relation to earnings—produced a median return of 13.4%. As the tide goes out, it does appear that highly-levered companies are being stranded on the beach.
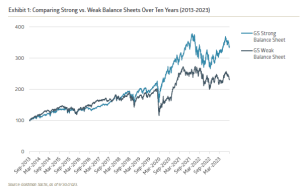
Goldman Sachs maintains various equity baskets to evaluate how certain factors are performing. Its “Strong Balance Sheet” sector-neutral basket includes 50 stocks from the S&P 500 with high Altman Z-scores, a measure of financial health. As shown in Exhibit 1, this basket of stocks has performed well relative to a basket of “Weak Balance Sheet” stocks over the past decade. Thus far in 2023, the strong balance sheet basket has outpaced the weaker balance sheet stocks by approximately 14 percentage points.3 This factor may be increasingly important as the economic cycle reaches its final stages. According to a Bloomberg article in July, nearly $600 billion of debt globally traded at distressed levels – defined as below $0.80 on the dollar and with a spread greater than 1,000 basis points.4, 5 More than a quarter of the distressed debt is tied to the real estate sector, more than any other industry group. To this point we haven’t seen any widespread outbreak of corporate defaults, although the collapse of Silicon Valley Bank and two other banks in March did briefly rattle investor confidence.
With the Fed’s proverbial foot firmly on the brake, it seems wise to pay close attention to the credit markets for signs of trouble.
Balancing Act
Appearances can be deceiving. There is a strong argument that the 13% total return for the market cap-weighted S&P 500 Index through the first three quarters of 2023 falls under this rubric. In comparison, the S&P 500 Equal Weighted Index managed less than a 2% return, lacking the cap-weighted upside provided by heavyweights Nvidia, Apple, Microsoft, and others. The latter feels more consistent with the big picture, including fairly sluggish earnings growth. Trailing twelve-month operating profits for the S&P 500 of roughly $208 per share through the second quarter were up less than 2% year-over-year. Wall Street expects that growth rate to improve over the final two quarters, but there are questions around the durability of profit growth in the face of higher input and borrowing costs.
U.S. Treasury Secretary Janet Yellen is not worried. When asked in September about the hopes for a “soft landing” in which a recession is avoided and inflation tamed, Yellen responded “I think you’d have to say we’re on a path that looks exactly like that.”6 The improvement in inflation is well documented: from a peak 9.1% rate for CPI ex-Food & Energy in June 2022 to 3.7% in the most recent (August 2023) reading. Yellen also highlighted an increase in labor force participation as “a clear plus” amid some easing in the labor markets. Although not a leading indicator, the U.S. employment picture remains encouraging. Nonfarm payrolls jumped 336,000 in September, while the unemployment rate stayed at 3.8%. This is particularly important because for consumers the excess savings are gone, according to the Federal Reserve’s latest survey of household finances. For the bottom 80% of households by income, aggregate bank deposits and other liquid assets were lower in June 2023 than they were in March 2020, inflation-adjusted.7 For those in the wealthiest quintile, the remaining excess savings were expected to have depleted in the third quarter. Sobering, perhaps, although the same Fed report indicated that household net worth rose approximately $5.5 trillion during Q2 to a record-high.
 Economists seem to have largely thrown in the towel on their recession calls. That could be a contrarian indicator, but to be fair, economic forecasting is exceedingly complex. There are political footballs being thrown around the Beltway that may cause a government shutdown, with higher U.S. Treasury interest rates causing budgetary stresses here as well. China is planning to take back their Giant Pandas from U.S. zoos, seemingly a new low in our diplomatic ties. War has once again broken out in the Middle East, and trudges on in Ukraine. It’s a mad world, full of unknowns, and boiling down all these variables might lead us back to restrictive monetary policy and its intended effects. The economic gears should turn more slowly in this higher rate environment, resulting in a more cautious capital allocation approach by corporations.
1 “Weekly Economics Summary,” Strategas Research, 10/1/2023.
2 Bloomberg data, Bailard calculations, 9/30/2023.
3 Strong Balance Sheet US / Weak Balance Sheet US, Goldman Sachs Marquee platform, 9/29/2023.
4 A basis point (“bp”) is 0.01%.
5 “A $500 Billion Corporate-Debt Storm Builds Over Global Economy,” www.bloomberg.com, 7/18/2023.
6 “Yellen ‘Feeling Very Good’ About US Sticking a Soft Landing,” www.bloomberg.com, 9/10/2023.
7 “Only Richest 20% of Americans Still Have Excess Pandemic Savings,” www.bloomberg.com, 9/25/2023.

Exploring the Possibilities of Generative AI
Dave Harrison Smith, CFA, Executive Vice President, Domestic Equities, and Head of Technology Research delves into—both massive and more mundane—potential advancements, impacts, and risks as generative AI leaps forward.
“ChatGPT just saved me,” my wife exclaimed earlier this week. As a legal manager she is often tasked with communicating complex issues, and in the past has found that she too often can come off as brusque and overly direct. She found herself spending hours wordsmithing memo introductions to strike a warmer tone while still maintaining a professional manner. This week, she dropped a draft introduction into the prompt box for the generative AI superstar ChatGPT and asked it to soften the tone and spin up a novel, friendlier introduction. Thirty seconds later her memo was complete, and she was thrilled.
While the Artificial Intelligence (AI) field has been under development since the 1950s, over the past year we have witnessed a monumental leap forward in a sub-branch of AI called generative AI. Specifically, the private company OpenAI released a revolutionary interface, ChatGPT, which comprised a powerful large language model (LLM) and a modern chat-based user interface. The readily accessible, easy to use interface—combined with the power of a learning model with hundreds of billions of parameters—had one AI expert saying it was akin to “looking into the face of God.” What has followed has been nothing short of remarkable: ChatGPT became the fastest consumer product to reach 100 million users (in a mere two months), academic scholars and open-source developers have made incredible strides with almost daily breakthroughs in generative AI research, and massive, trillion-dollar companies and well-known start-ups have rapidly pivoted strategies to embrace the potential of generative AI.
ChatGPT saving my wife a half hour of work writing an email introduction may not sound groundbreaking, but it’s our belief that generative AI has the capacity to make a powerful difference in the world. The average individual’s perception of economic progress is unfortunately frequently tied to the business cycle or stock market returns. Ask a person on the street how humanity has done over the past 40 years and the answer may well depend on the state of their local economy. Economists would argue that, in the long run, prosperity is tied directly to productivity growth. An increase in the average output per hour of labor worked means that the economy is growing, with our per capita income similarly increasing. Unfortunately, by many measures, productivity growth has stalled since the early 2000s. Disappointed economists have offered a myriad of reasons for the slowdown, including demographics and the lack of life-changing inventions, like the internal combustion engine, but the growth stagnation has continued unabated.
Enter Generative AI
Through our research, we have come to believe generative AI technology is key to unlocking a step function increase in productivity growth and, longer term, our quality of life. News and social media feeds alike are already flooded with peers using generative AI to save immense amounts of time. Professors are generating the framework of a new paper in hours rather than days. Programmers are debugging code in minutes rather than hours. Marketers are creating content drafts in seconds rather than minutes or hours.
These productivity gains are showing in academic studies, as well. Scholars Brynjolfsson, Li, and Raymond found that access to a generative AI tool increased call center worker productivity by 14% and by 30% for lower skilled and newer employees.1 Kazemitabaar et al found that the productivity of programmers was increased by 1.8x when they were paired with a code generating AI co-pilot.2 Incredibly, we believe we are just scratching the surface of what this technology can do, and we expect to see a Cambrian explosion of uses and products over the coming months and years. In a thought piece from its research team, Goldman Sachs stated that the “…proliferation of consumable machine learning and AI has the potential to dramatically shift the productivity paradigm across global industries, in a way similar to the broad scale adoption of internet technologies in the 1990s.”3 Like the early days of the internet, many of these products will sputter, but we believe the next crop of great technology products is poised to rise from this new ecosystem.
Acknowledging the Ghosts in the Machine
The benefits of generative AI have the potential to be profound. Yet, it is important to recognize the risks as well. The media is already awash with stories of students using ChatGPT to generate essays. While cheating should never be excused, these stories may one day seem trivial to larger threats that are far more dangerous. We are just beginning to grasp the impact of disinformation in the democratized media world of Twitter and Facebook. Imagine now, that bad actors can generate AI optimized content in text, image, and even video form that appears accurate and true. Unfriendly nations and terrorist organizations will gain a powerful new weapon when the cost of generating new falsehoods falls to zero.
 Similarly, we are just beginning to understand the ‘ghosts in the machine’—the unanticipated errors and dangers—that are present in the current generation of AI platforms. At their very core, AI platforms are not trained to give correct answers. Instead (at a vastly oversimplified level), the technology is in effect statistically predicting strings of words that are likely to be paired together, based on unfathomable amounts of data. It is nothing short of magical when it works. And it is nightmarish when it fails. A prominent Washington law professor was recently the victim of a false ‘fact’ given by ChatGPT when it listed him as having been accused of sexual harassment. The ChatGPT story was complete with sources and looked identical to a factual statement. The only issue is that it was completely fabricated by the machine. While we are just beginning to understand how generative AI can help us in our daily lives, we are also just beginning to feel the pain from the other side of the double-edged sword.
Potential Effects of Productivity Change
The impact on employment is another topic of significant debate. We have argued in the past that technological shifts are not zero sum games. If call center employees are 15% more productive, that may mean a company needs to employ fewer call center agents. However, these agents are now able to find employment in other jobs and, from an aggregate standpoint, the overall economy grows. Yet, this line of reasoning can feel heartless and myopic; looking at aggregate numbers ignores the fact that these are real people with real families losing their jobs. “The productivity effects of generative AI are likely to go hand in hand with a significant disruption in the job market as many workers may see downward wage pressures,” according to the Brookings Institute.4
We are reminded of John Steinbeck’s famous work The Grapes of Wrath, where the breakthrough technology of the tractor enabled one farmer to do the work of 15, displacing tens of thousands of poor farmers and sharecroppers. The misery of these families is chronicled in detail, despite the long-term economic growth the technology enabled. It is critical that our society recognizes the pain that frictional unemployment can cause and ensures that proper investments in job training and safety nets are in place.
There is still a great deal of uncertainty surrounding generative AI. The common maxim that we are overestimating the impact in one year and underestimating the impact in ten years will likely hold true. As investors, we need to be aware of the hype surrounding the technology, as it can create bubbles of over-valuation, a la countless transformational technologies in the past. As users and as a society, we need to be aware of the risks and threats that the new technology can precipitate.
It’s our belief that this represents the next great technological evolution and, in the medium to long term, has the potential to meaningfully impact worker productivity and significantly enhance our daily lives, perhaps on par with some of the great technological leaps of the past century. We also believe there will be a significant opportunity set created for entrepreneurs and savvy investors over time. Bill Gates called generative AI the most revolutionary technology he has seen since the graphical user interface,5 which spawned the Windows operating system. Certainly, Gates knows a thing or two about generational technological shifts. We can’t wait to see what the future holds.
1 Brynjolfsson, E., Li, D., & Raymond, L. R. (2023, April 24). Generative AI at work. NBER. https://www.nber.org/papers/w31161.
2 Kazemitabaar, M., Chow, J., Ma, C. K., Ericson, B. J., Weintrop, D., & Grossman, T. (2023, April 19). Studying the effect of AI Code Generators on Supporting Novice Learners in Introductory Programming. ACM Digital Library. https://doi.org/10.1145/3544548.3580919.
3 Goldman Sachs Global Investment Research. (2016, November 14). Profiles in Innovation: Artificial Intelligence. https://www.gspublishing.com/content/research/en/reports/2019/09/04/a0d36f41-b16a-4788-9ac5-68ddbc941fa9.pdf.
4 David Kiron, E. J. A., David Autor, A. S., Sanjay Patnaik, J. K., Ajay Agrawal, J. S. G., Sukhi Gulati-Gilbert, R. S., & Nicol Turner Lee, A. K. (2023, June 29). Machines of mind: The case for an AI-powered productivity boom. Brookings. https://www.brookings.edu/articles/machines-of-mind-the-case-for-an-ai-powered-productivity-boom/.
5 Gates, B. (2023, March 21). The age of AI has begun. GatesNotes. https://www.gatesnotes.com/The-Age-of-AI-Has-Begun.
Value-Based Healthcare: A Transformative Approach
There’s an alternative to the traditional fee-for-service healthcare model. Ryan Vasilik, CFA, Equity Analyst, sheds light on the opportunities that abound with value-based care.
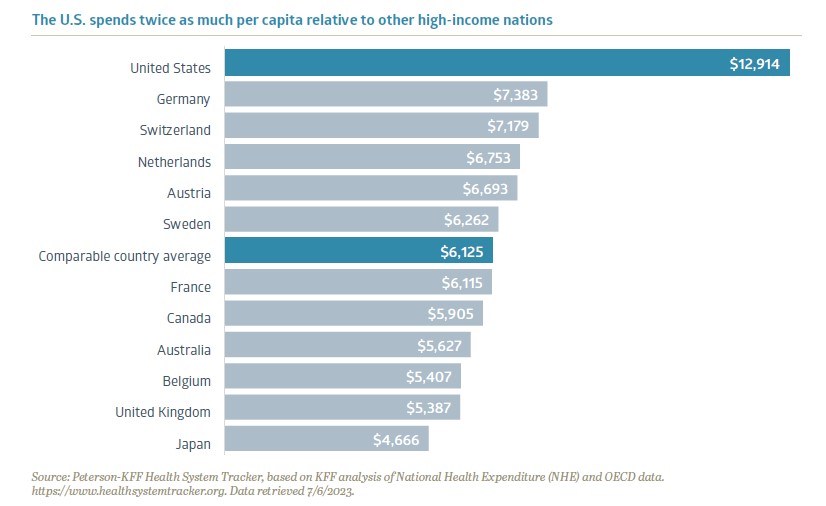
For decades, narratives about the escalating costs of healthcare and its impact on affordability have remained at the forefront of American concerns. Most people either know of, or have personally experienced, financial hardship when dealing with medical issues. In fact, medical bills are the leading cause of personal bankruptcy in the U.S.1 Compared to other industrialized nations, the U.S. spends twice as much per capita on healthcare services. High healthcare spending by itself isn’t necessarily a negative; shockingly though, despite spending twice as much as its peers, the U.S. also ranks dead last on measures like life expectancy and patient satisfaction.
While there are many stakeholders involved in our healthcare system, there is no single villain responsible for driving up costs and there is no silver bullet solution. Fortunately, new healthcare delivery alternatives are emerging to help bend the cost curve and substantially improve patient outcomes. One new healthcare paradigm to address these challenges is value-based care. We believe the emergence of value-based care will revolutionize our perception of the U.S. healthcare system and holds the potential to enhance cost efficiency, patient outcomes, and open new horizons for entrepreneurs and established companies alike.
A Game-Changing Approach
Value-based care (VBC) is a transformative approach to delivering healthcare, where stakeholders compete on the quality of patient outcomes instead of quantity. All parties have skin in the game and are financially at risk if patient results deteriorate. VBC healthcare providers receive a risk-adjusted annual fee per patient from insurance payors and are responsible if patient complications arise. Healthcare providers and payors are aligned to properly diagnose, direct, and treat patients throughout the medical episode, thus focusing on preventative care and keeping patients out of the hospital.
Under this new model, healthy patients and provider profitability go hand-in-hand. The goal for the provider is to generate excess profit by managing patient pools in a more efficient manner. Traditionally, the U.S. healthcare system has employed a “fee for service” delivery model, where providers are paid on patient visits. This model has been criticized due to the potential for conflicts of interest where the provider benefits the more a patient utilizes medical care. Insurance companies complicate the issue, as they are often responsible for covering the medical bills of patients and may attempt to ration care or shift costs to protect their bottom line. Value-based care is a new form of competition that focuses on long-term medical outcomes for patients and lowers costs for payors in a sustainable way. The beauty is that it corrects the downfalls of the fee-for-service model. While fee-for-service treatment is frequently criticized for waiting for a patient to get sick before receiving care, value-based medicine relies on investing in systems to help providers diagnose or even prevent illnesses early and match patients to the appropriate care facilities to improve their lives throughout the healthcare continuum.
 The push for value-based care originated through Medicare Advantage, an additional insurance program for seniors that offers supplementary benefits alongside regular Medicare. Utilizing a VBC model within the Medicare Advantage population was a logical first step, due to the significant potential for reducing costs in this program. Although comprising only one-sixth of the U.S. population, individuals aged 65 and above account for over one-third of all medical expenditures. The VBC model has been widely viewed as a success within Medicare Advantage. Today, roughly six million Medicare Advantage patients have physicians who contract with VBC providers.2 This figure is projected to increase as Medicare officials have expressed a goal to establish value-based care relationships for every Medicare beneficiary by 2030.3
Beginning with the PCP
The foundation of value-based care begins with the primary care physician (PCP). Providing concierge-level care, primary care physicians and their team interact with patients up to ten times per year at no additional cost to patients. Doctors spend a greater amount of time with their patients to monitor their health and provide follow-up care to make sure patients are achieving their health goals. These additional interactions are not trivial; for example, doctors found that weighing patients who have congestive heart failure once a day can help identify whether a patient’s heart failure is deteriorating. This additional data can help the patient’s medical team intervene earlier, potentially halt the deterioration, and keep the patient out of the emergency room.
Unfortunately, data has shown that under the current system, many patients use the emergency room as their primary care doctor, racking up thousands in unnecessary medical bills and often leading to an expensive downward spiral. Some of the lowest hanging fruit for cost reduction is directing patients to the appropriate center as an alternative to expensive emergency room visits. Steering patients to lower-cost locations, such as suburban offices instead of city centers or even coming to the patient’s own home, can achieve the same or potentially superior medical benefit at a fraction of the cost. Ultimately, under VBC, a healthier patient leads to less medical spending that needs to be reimbursed by payors, leading to better healthcare outcomes at lower costs.
Nearing an Inflection Point
The value-based care industry has experienced enormous growth over the past few years, and we are now reaching an inflection point. As the healthcare industry gets more comfortable with VBC models, we believe the next evolution will be focused on three key areas: optimizing care coordination, broadening data capture, and expanding VBC to reach new patient populations.
The move towards VBC within specialty chronic conditions, like kidney disease or diabetes, is a logical next step. Managing chronic diseases involves interacting among multiple specialty physicians and teams. By organizing care coordination specifically around these diseases, we can break down information barriers and eliminate redundant treatments.
Payors will increasingly demand clinical studies from drug and medical device companies that not only demonstrate the efficacy of the product, but also quantify the total lifetime savings generated by these products. Companies that present data showing how their drugs or devices both directly and indirectly prevent future complications will earn higher status in formularies.
The principles of value-based care can also be applied to younger patient demographics. Helping facilitate this demographic expansion are private healthcare information technology companies who provide software and patient management insights that enable providers to enter into value-based relationships at minimal financial risk. As healthcare providers and payors accumulate more data, they can adopt best practices and realize the benefits observed in senior populations.
Change is Not Impossible
As a nation, we all have a stake in healthcare reform and improving patient care. The destiny of the U.S. healthcare system is not predetermined, and it would be a mistake to assume that change is insurmountable. Each year, a new class of visionaries sets out to tackle the healthcare cost dilemma.
While still in early days, we believe value-based care can materially shift the U.S. healthcare delivery model. Given the nascent state and dynamic evolution of the model, it presents a golden opportunity for entrepreneurs and investors, promising lucrative rewards for those who emerge as winners. Monumental progress has been made since the beginning days, and we have real world data measured over years that shows VBC works. The shift towards this new model will not happen overnight, but the evidence is clear that our path forward to reimagining healthcare is through value-based care.
1 Bedayn, J. (2023, April 17). States confront medical debt that’s bankrupting millions. AP News. https://apnews.com/article/medical-debt-legislation-2a4f2fab7e2c58a68ac4541b8309c7aa.
2 U.S. Centers for Medicare & Medicaid Services. (2023, April 5). Medicare Advantage Value-Based Insurance Design Model Extension Fact Sheet: CMS Innovation Center. Innovation Center. https://innovation.cms.gov/vbid-extension-fs.
3 King, R. (2022, April 29). CMMI’s Liz Fowler calls for better approach to educating public, lawmakers on value-based care. Fierce Healthcare. https://www.fiercehealthcare.com/providers/cmmis-liz-fowler-calls-better-approach-educating-public-lawmakers-value-based-care.

Economic Brief: Portfolio Theory
This quarter’s economic perspective of Jon Manchester, CFA, CFP® (Senior Vice President, Chief Strategist – Wealth Management, and Portfolio Manager – Sustainable, Responsible and Impact Investing) runs the gamut from Harry Markowitz to Taylor Swift.
In late June, at 95 years old, Nobel prize-winning economist Harry Markowitz passed away in San Diego, CA. He leaves behind an immense legacy in the investment field, with his fingerprints in virtually all professionally-managed portfolios today. As the Financial Times put it: “The study of finance can easily be split into two eras: before and after Harry Markowitz.”1 Prior to the 1952 publication of his groundbreaking University of Chicago PhD dissertation titled “Portfolio Selection,” investment portfolios tended to be assembled in a somewhat haphazard manner, a collection of individual securities each assessed in isolation from a risk and return perspective with scant attention paid to how the puzzle pieces fit together. Diversification was a well-known concept, but Markowitz’s work provided a mathematical approach to evaluate risk/return tradeoffs holistically, at the portfolio level. Rob Arnott, founder of asset management firm Research Affiliates, noted “Before Harry, investing was a bunch of rules of thumb.”2
In awarding him the 1990 Alfred Nobel Memorial Prize in Economic Sciences—shared with Merton Miller and William Sharpe for separate (but in Sharpe’s case, related) achievements—the Royal Swedish Academy of Sciences lauded Markowitz’s pioneering contributions to portfolio choice. Importantly, Markowitz illustrated the importance of how each asset in a portfolio contributes to the overall risk by considering how the securities move in relation to one another. In other words, how correlated are the assets in a given portfolio? This had significant and enduring implications for portfolio management. Adding a high-risk biotechnology stock to a portfolio otherwise composed entirely of low-risk, regulated utilities stocks could in fact lower the risk of the overall portfolio compared to a broad equity benchmark, given the low correlation between the price movements of the two vastly different industries. This enabled investment managers to evaluate a potential investment in the context of the overall risk picture, and gave rise to the construction of more well-diversified portfolios across asset classes.
The adoption was not immediate, however. According to a Financial Analysts Journal article, Markowitz’s ideas took more than 20 years to catch on.3 It required the “shock wave of the early 1970s stock market selloff and the passage of ERISA” to compel investors to build sturdier portfolios, plus the eventual development of faster computing power to handle the necessary calculations.
The investment world has, not surprisingly, evolved at a dizzying pace in the half-century since the inflationary 1970s, but Markowitz’s core architecture of creating optimal, efficient portfolios across the risk-return spectrum still has a place in the latest iterations of his Modern Portfolio Theory (MPT). It does not necessarily help CNBC gain viewers, though, which is why a recent Bloomberg opinion piece on Markowitz observed that “most investment coverage today is about which securities will go up or down in price, not which ones are shrewd bets, and definitely not which ones have desirable correlations to be part of portfolios with attractive risk/return ratios.”4
The Big Seven
One can’t help but wonder how Markowitz would assess the current state of the U.S. large-cap equity market. As someone who was reportedly consumed with the statistical properties of portfolios of securities, it’s probably safe to assume he would be intrigued by the very narrow band of stocks carrying the overall Standard & Poor’s 500 Index. The Index returned 8.7% including dividends in the second quarter, taking its year-to-date total return up to 16.9%. Nearly three-quarters of the Index’s 2023 return thus far can be attributed to just seven stocks: Apple, Microsoft, Nvidia, Amazon, Meta Platforms, Alphabet, and Tesla. Three of those companies—Nvidia, Meta Platforms, and Tesla—saw their stock prices soar more than 100% higher during the first half of 2023. Media outlets have started referring to this group as either the “Big Seven” or sometimes the “Magnificent Seven,” which in itself is concerning. When stocks have done well enough collectively to earn a nickname, it might suggest that future profits are fairly well discounted in the stock prices. At present, the Big Seven trades for an average forward price/earnings ratio of roughly 36x. The overall Index trades at a robust 20.5x estimated 2023 operating earnings per share, and Morgan Stanley calculates that the median S&P 500 stock valuation lands in the 89th percentile historically.5
 For companies outside the Big Seven, returns haven’t been as gaudy. The median total return for S&P 500 companies was a relatively pedestrian 4.8% over the first half of 2023. Tracing back further to the end of 2021, one trading day short of the market’s all-time peak, only 35% of S&P 500 stocks had higher prices on June 30 compared to then. The remaining 65% were still trying to climb back following an ugly 2022, and that list includes Big Seven members Tesla, Alphabet, and Meta Platforms. All this is to say the list of winners within the U.S. large-cap universe is a fairly exclusive club, and a common theme for outperformers this year has been stocks perceived to benefit directly or indirectly from generative artificial intelligence (AI). Per a Bloomberg article: “The market’s fascination with the power of generative AI has trumped every major issue that could potentially drag down sentiment this year: recession fears, elevated levels of inflation, prospects for more Federal Reserve hikes, geopolitical risks, the debt-ceiling debate and the collapse of a few regional banks.”6
Despite the AI frenzy, research from Strategas points out that the real bull market has been in money market flows. Since the S&P 500’s low point last October, investors have directed four times as much into money market funds as compared to equity exchange-traded funds.7 Strategas believes those flows reflect a “ton of equity market apathy,” but sharply higher money market yields are no doubt a major factor as well, plus the scramble to avoid holding bank cash above limits insured by the Federal Deposit Insurance Corporation (FDIC). The Federal Reserve’s (the Fed’s) monetary tightening campaign has lifted short-term yields up near 5%, attracting the income-focused crowd. Meanwhile, the distrusted rally in equities continues to climb the wall of worry that Bloomberg outlined, and it has the potential to continue as more investors get off the sidelines and belatedly look to participate in further upside. There are some signs of froth in the markets, however, whether it’s increasingly rich valuations paid for growth stocks or the mid-June initial public offering (IPO) of unprofitable restaurant chain CAVA Group, which saw the stock nearly double on its first day of trading amidst a dearth of listings.
Mind the Lag
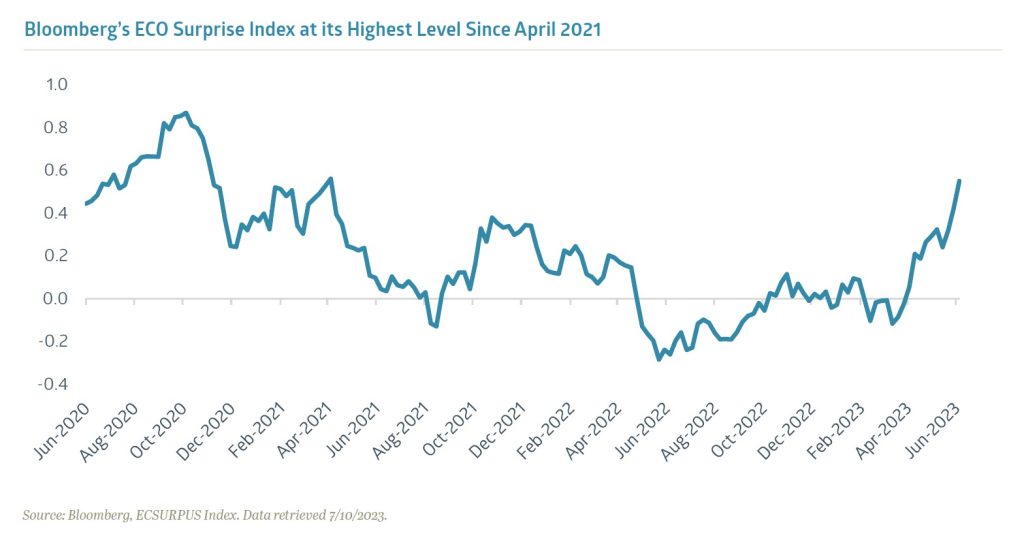
Economic growth in the U.S. has aided the markets thus far in 2023 by being neither too hot nor too cold, the precise porridge that can keep bears at bay. Gross Domestic Product (GDP) rose at a 2% annualized pace in the first quarter, adjusted for inflation, and the Atlanta Fed’s GDPNow estimate for second quarter growth is about the same. With many economists initially projecting a mild recession during 2023, the economic data thus far has proved better-than-feared. Bloomberg’s ECO Surprise Index measures the aggregate differentials between the actual values of economic releases and analyst forecasts. After a flattish start to the year, the ECO Surprise Index moved steadily higher in May and June to its highest level since April 2021. While asking if it’s time to cancel the recession altogether, Bloomberg columnist Jonathan Levin observed that economists have started throwing in the towel on a recession starting in the third quarter.8 The consensus estimate for Q3 real GDP annualized growth is now roughly flat, up from a trough forecast of -0.9% in May.
There remain ample reasons to be pessimistic. Chief among those is the Fed’s yet unfinished inflation battle. Although inflation has shown significant improvement—with the headline Consumer Price Index (CPI) decelerating to a 4.0% year-over-year growth rate in May—the Fed’s dot plot indicates it expects to raise the target Fed Funds rate by another 50 basis points9 to 5.75% at the upper end. Whether or not that happens, there is concern that the economy has yet to truly feel the impacts of tighter monetary policy. There is typically a lag between the policy changes and when economic metrics start to reflect those moves. Given the Fed lifted its target rate by five percentage points between March 2022 and May 2023, the fastest hiking pace in over four decades, it seems reasonable to withhold judgement before declaring the economy immune to higher rates.
 There is also the inconvenient truth that the U.S. Treasury yield curve has been consistently inverted for a year now, with the two-year yield at 4.89% as the second quarter ended, versus 3.83% for the 10-year note. Historically, this has suggested a recession lies ahead. The Conference Board’s Leading Economic Index (LEI) hasn’t inspired confidence either, moving lower 14 consecutive months through May. Projecting that the U.S. economy will contract over the Q3-2023 to Q1-2024 timeframe, The Conference Board said the “recession likely will be due to continued tightness in monetary policy and lower government spending.”10
This dour outlook for economic growth remains at odds with the surprisingly sanguine economic data we’ve seen. Notably, few cracks have emerged in the all-important labor market. Retail sales advanced at a 1.7% year-over-year rate in the three months ending in May, which might qualify as desirably lukewarm. Perhaps music superstar Taylor Swift deserves some credit for the economic resilience. As her current tour rolls around the country providing a boost to local economies—which some have compared to hosting the Super Bowl—one study estimated the Swifties will generate $5 billion in economic impact, more than the GDP of 50 countries.11 While admittedly small in the context of a roughly $26 trillion U.S. economy, Swiftonomics is clearly not the problem. We just need her to continue touring the states indefinitely, until generative AI is ready to take over completely.
1 “Harry Markowitz, economist, 1927-2023,” www.ft.com, 6/30/2023.
2 Ibid.
3 “Harry M. Markowitz: Profile of an Industry Leader,” www.cfainstitute.org, Q4 2017.
4 “Nobel Laureate Harry Markowitz Was a Misunderstood Economist,” www.bloomberg.com, 6/26/2023.
5 “US Equity Strategy,” Morgan Stanley Research, 6/26/2023.
6 “Big Seven Powering $5 Trillion Nasdaq 100 Rally,” www.bloomberg.com, 6/30/2023.
7 “Key Charts For 1H Client Letters & Look Ahead,” Strategas ETF Research, 6/27/2023.
8 “Is It Time to Cancel the Recession Altogether?,” www.bloomberg.com, 6/27/2023.
9 A basis point (bp) is 0.01%.
10 “LEI for the U.S. Declined Further in May,” www.conference-board.org, 6/22/2023.
11 “Generating $5 billion, the Taylor Swift The Eras Tour has an Economic Impact Greater than 50 Countries,” www.bloomberg.com, 6/8/2023.

Economic Brief: Alphabet Soup
This quarter, we feature the economic perspective of Jon Manchester, CFA, CFP®, Senior Vice President, Chief Strategist – Wealth Management, and Portfolio Manager – Sustainable, Responsible and Impact Investing.
March 31, 2023
When U.S. president Franklin Delano Roosevelt (FDR) first took office in March 1933 he was 51 years old and tasked with the monumental challenge of somehow lifting the country out of the Great Depression. He had work to do on nearly every front. At the top of that list, however, was shoring up the nation’s beleaguered banking system. Roughly 4,000 banks had closed in the first few months of 1933 alone, adding to a series of bank runs and failures in prior years.1 One of FDR’s first moves was to declare a national banking holiday, a euphemism for temporarily shutting down the banking system. That was followed days later by the passage of the Emergency Banking Act (EBA), which importantly gave Federal Reserve Banks the right to issue emergency currency to struggling banks in the form of Federal Reserve Bank Notes. His inaugural “Fireside Chat” took place on March 12, 1933 and began with FDR calmly saying over the airwaves, “My friends, I want to talk for a few minutes with the people of the United States about banking.”2
 By June 1933, FDR was only three months into his term, but it may have felt like three years to him, following what is now considered the most productive first 100 days of any presidency and the benchmark against which all future presidents would be measured. Congress passed 77 laws during that frenetic special session, including 15 landmark bills that were the bedrock of FDR’s First New Deal. Among the flurry of legislation were bills creating the first of what some referred to as FDR’s alphabet agencies: the Civilian Conservation Corps (CCC), Tennessee Valley Authority (TVA), and others. For a man known by his initials, perhaps it was fitting that his office spawned a whole host of federal government agencies known primarily by theirs. Not everyone was a fan of the bulked-up bureaucracy. Former New York governor Al Smith reportedly groused that Roosevelt’s government was “submerged in a bowl of alphabet soup.”3
One of those 15 landmark bills was the Banking Act of 1933, enacted that June. It established the Federal Deposit Insurance Corporation (FDIC), another of the alphabet agencies, and a particularly critical one viewed from the lens of today, 90 years later. Informally called the Glass-Steagall Act after its sponsors—Senator Carter Glass of Virginia and Representative Henry Steagall of Alabama—its main purpose was to separate commercial banking from investment banking. Interestingly, the provision that created the FDIC was much more controversial, even drawing veto threats from FDR.4 He signed the bill, however, and the FDIC was born, with deposits insured up to $2,500 initially at member banks. That coverage was soon doubled to $5,000 in 1935 and is $250,000 today.
The sudden demise of both Silicon Valley Bank (SVB) and Signature Bank in March 2023 were stark reminders of both the importance of FDIC insurance and its limitations. As the second and third-largest bank failures in U.S. history, trailing only Washington Mutual in 2008, government officials determined the one-two punch required a new approach to stabilize the banking system. In a joint statement between the Treasury department, the Federal Reserve, and the FDIC, it was announced all depositors would be made whole as a “systemic risk exception.”5 In other words, the $250,000 FDIC insurance cap was waived, in an effort to prevent a widespread banking panic. The FDIC has travelled a great deal from its humble roots as a late add-on to the Glass-Steagall Act.
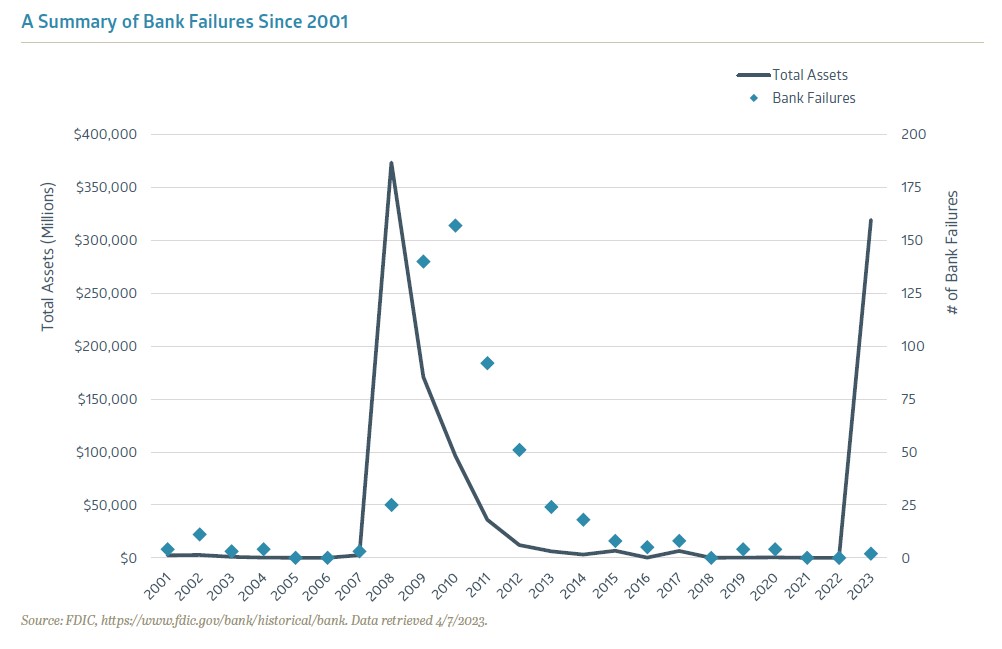
Available for Sale
Whether the banking turmoil ultimately proves a tempest in a teapot seems largely dependent on the same variables we’ve been discussing for a while now: inflation and interest rates. Persistently high inflation and a sharply inverted yield curve is not the desired formula. Shortly after the bank failures, the Federal Open Market Committee (FOMC) decided to continue the inflation fight by raising the target Fed Funds rate to an upper limit of 5.00%. Some expected the Fed to pause in the wake of the banking instability, but in their statement the Committee said they remain highly attentive to inflation risks. They did acknowledge that “recent developments are likely to result in tighter credit conditions for households and businesses and to weigh on economic activity, hiring, and inflation.”6 Meanwhile, longer-term interest rates declined in March. The benchmark 10-year U.S. Treasury Note yield fell from nearly 4% at the beginning of the month to below 3.5% when the first quarter hit the finish line.
Nonetheless, the 10-year U.S. Treasury Note yield remains well above its levels from 2020-21, when it didn’t top 2% and spent much of 2020 below 1%. Therein lies a significant part of the problem for Silicon Valley Bank and other banks who invested heavily in low-yielding government paper during that time frame. According to the Federal Reserve Bank of St. Louis, just prior to the pandemic, roughly 20% of bank assets consisted of investment securities – primarily mortgage-backed and U.S. Treasury bonds.7 By the end of 2021, security holdings had increased to 25%, and many of the purchases were longer maturity bonds, which are more vulnerable to rising interest rates. When Silicon Valley Bank depositors fled in mass, the bank was left technically insolvent due to significant losses on the bonds in its investment portfolio. Although you can argue that uninsured SVB depositors were acting rationally, it brings to mind the famous quote often attributed (perhaps wrongly) to famed British economist John Maynard Keynes: “The market can stay irrational longer than you can stay solvent.”
The tighter credit conditions mentioned by the Fed could pose a challenge for economic growth and corporate earnings. Notably, after an enormous spike in money supply during 2020—as measured by M2, which includes cash, bank deposits, money market funds, and other types of deposits readily convertible to cash including certificates of deposit—it is now falling at the fastest rate since the 1930s.8 This can be partly attributed to a normalization of money supply following the extraordinary fiscal and monetary stimulus measures during the pandemic, but it is something to monitor as 2023 progresses.
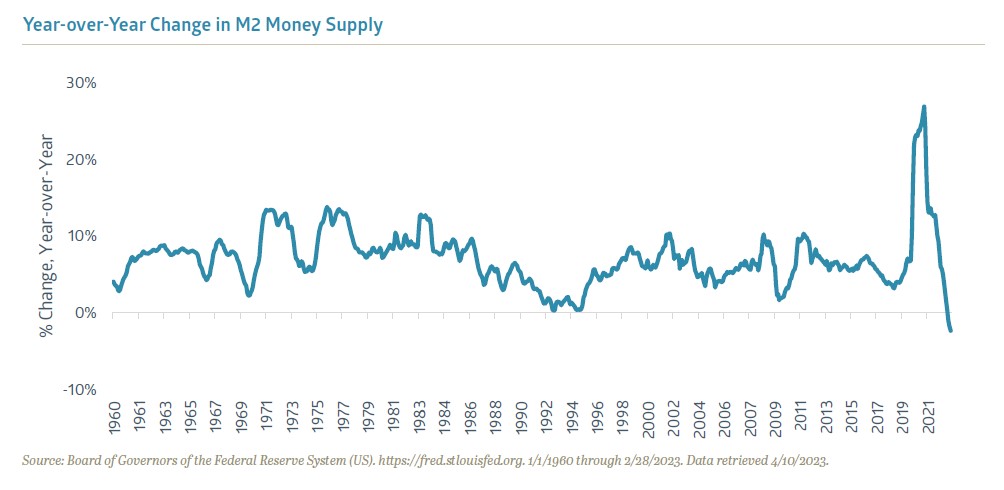
Higher borrowing rates and tighter lending standards have the potential to dampen economic growth in a hurry. The Chicago Fed’s National Financial Conditions Index takes into account 105 indicators of financial activity, a wide variety of interest rate and credit spreads, plus other metrics. It has been moving higher over the past year, indicating tighter financial conditions, which the Fed wants to see for the inflation fight, but runs the risk of inducing the much anticipated recession.
Market Incongruences
While the yield curve continues to suggest a slowdown lies ahead, equities shrugged off the banking tremors and put together a surprisingly strong first quarter. In fact, in case your phone didn’t notify you, the tech-heavy Nasdaq 100 Index hit bull market territory near the end of March. The Standard & Poor’s 500 Index returned 7% price-only in Q1-23, with last year’s sector laggards—Communication Services, Technology, and Consumer Discretionary—the leaders as part of a fairly strong rotation into growth stocks.
The equity market’s resilience seems underpinned by a familiar carrot: the promise of lower interest rates. According to the CME FedWatch Tool, Fed Funds futures are now pricing in a greater than 50% probability that the FOMC pauses at 5.00% over the next two meetings in May and June, respectively, before potentially cutting the target rate in the back half of 2023.9 The highest probability currently assigned to the December FOMC meeting is 4.25%. This rising expectation that the Fed will reverse course has encouraged investors to move into longer duration, growth stocks.
History shows that equities tend to perform well following a peak in the Fed Funds rate. This doesn’t hold 100% of the time, however, and there are reasons to be cautious this time around. Inflation isn’t kicked yet, for starters. The Consumer Price Index (CPI) was still running at +6.0% year-over-year as of February, and the Personal Consumption Expenditures (PCE) core price index at +4.6%. Both have improved, but the Fed knows it isn’t time to declare victory yet. They may be able to pause, but the futures market could be mistaken in projecting a lower Fed Funds rate this year. Equity market valuations are another potential headwind. The S&P 500 Index closed Q1-23 at nearly 19x projected 2023 operating earnings. The excess valuation levels of 2021 have been corrected, but U.S. large-cap stocks are not cheap. In fact, Goldman Sachs Research said in late March that the S&P 500’s forward valuation ranked in the 82nd percentile since 1980.10 Other areas of the equity markets are less demanding from a valuation perspective.
With the fixed income and equity markets offering contrasting signals, it would seem one group of investors has to be wrong, assuming returns don’t move in tandem as they did in 2022. The odds appear more stacked against equities given restrictive monetary policy and what’s expected to be a more cautious lending environment, plus modestly elevated valuations as a starting point. Economic growth in the U.S. may be muted. The Conference Board’s Leading Economic Indicators (LEI) Index declined for an eleventh-straight month in February 2023. Per the release: “The Conference Board forecasts rising interest rates paired with declining consumer spending will most likely push the US economy into recession in the near term.”11 They expect just 0.7% real GDP growth this year.
It is safe to assume that FDR would strike an optimistic tone at this moment. Perhaps we could all use a genial Fireside Chat to remind us that the employment picture is exceedingly strong, housing prices were up 3.8% year-over-year in January, according to the S&P Case-Shiller Home Price Index, and the banking system remains sound in part thanks to an alphabet agency created 90 years ago. This doesn’t look like another credit crisis, but even FDR would admit there are obstacles to overcome if risky assets are to perform well.
1 “The First Fifty Years: A History of the FDIC 1933-1983,” www.fdic.gov
2 FDR Fireside Chat, www.fdr.blogs.archives.gov, 3/12/1933
3 “Safire’s Political Dictionary,” William Safire
4 “Banking Act of 1933 (Glass-Steagall),” www.federalreservehistory.org
5 “Joint Statement by Treasury, Federal Reserve, and FDIC,” www.federalreserve.gov, 3/12/23
6 “Federal Reserve issues FOMC statement,” www.federalreserve.gov, 3/22/23
7 “Rising Interest Rates Complicate Banks’ Investment Portfolios,” www.stlouisfed.org, 2/9/23
8 “Column: US money supply falling at fastest rate since 1930s,” www.reuters.com, 3/30/23
9 FedWatch Tool,” www.cmegroup.com, 4/4/23
10 “US Weekly Kickstart,” Goldman Sachs Research, 3/24/23
11 “LEI for the U.S. Continued to Decline in February,” www.conference-board.org, 3/17/23

The Demand for "Attainable A" Multifamily Housing
Jamil Harkness, Research and Performance Associate, offers a broad introduction to the potential for attractive investment opportunities in a segment of the multifamily property type that Bailard defines as “Attainable A.”
The Bailard real estate team has long believed in the advantages of investing in multifamily properties, mainly for the consistent cash flow, manageable volatility, lower capital intensity, and the asset type’s ability to adjust to broader economic conditions more quickly.
Supply & Demand
In the largest 40 U.S. metropolitan areas, roughly one-third or 4.5 million units of the multifamily housing inventory (defined as apartment complexes of 20 or more units) comprise Class A units. Within this category, the more expensive “trophy luxury A” and “luxury A” tiers represent 11% and 52%, respectively. The lower-cost end of the Class A spectrum, the remaining 37%, represents what the Bailard team defines as “Attainable A” properties.
According to CoStar, multifamily supply and demand dynamics at the end of 2022 favored Attainable A properties. As a result, despite a general slowdown in demand across all segments and geographies in the past year, the vacancy rate for Attainable A only increased by 1%, reaching 6.4% by year-end 2022. In contrast, the vacancy rate for trophy luxury A and luxury A properties increased by 1.2% and 1.1%, respectively, ending the year at 8.7% and 9.2%.
Rents for Attainable A increased 3% year-over-year in 2022, with the average asking rent for all unit types within this segment reaching $1,726 per month. Comparatively, average asking rents for trophy luxury A and luxury A reached $3,425 and $2,250 per month, respectively: rent growth of 2.6% and 2.3%, substantially lagging Attainable A.
Defining Attainable A
The Bailard Real Estate team defines Attainable A as high-quality, well-amenitized, recent-vintage, moderately priced multifamily properties generally located in close-in and first-ring suburban markets. Attainable A differs from trophy luxury A and luxury A in several respects, including design, materials, finishes, amenities, and locational attributes. Exhibit 1 enumerates a variety of features that help frame the similarities and differences of the three Class A apartment segments.
 Attainable A multifamily is often a good fit for middle-income “renters-by-necessity.” Pew Research defines middle-income earners as individuals who make between 75% and 170% of the median income. According to the Bureau of Labor Statistics, median income for an individual in 2022 was $54,132. Therefore, target renters for Attainable A are those middle-income earners who have an annual income of $40,600 to $95,000.
Middle-income renters account for 54.3% of U.S. renters and the majority fall within the 22 to 45 age group, which comprises Gen Z, Millennials, and Gen X. Almost half, 49.6%, either live alone or with roommates. A sample of the kinds of occupations that provide the foregoing levels of compensation are as follows: carpenters, plumbers, firefighters, police officers, office managers, nurses, teachers, sales associates, marketing managers, surgical technologists, IT professionals, project managers, and real estate agents.
Data obtained from Costar indicates trophy luxury A and luxury A one-bedroom apartments in urban or in-fill neighborhoods average $3,000 and $2,100 per month, respectively, making them unaffordable for most middle-income individuals. However, an Attainable A one-bedroom apartment in a first-ring suburban market rents for approximately $1,440 per month. To qualify using the traditional “35% of salary” rent affordability metric, a $49,000 annual income is needed for Attainable A, while $102,000 and $75,000 per year is the baseline for trophy luxury A and luxury A properties.
The Case for Attainable A
Over the past decade, the 40 largest metropolitan areas have seen completed construction of 2.9 million multifamily units. Class A apartments, across all segments, accounted for 86% of these new deliveries. However, only 587,000 Attainable A apartments were constructed, only a quarter of that large Class A pie slice. Many middle-income Americans are experiencing limited affordable housing options.
Despite the modest number of Attainable A apartments completed in the last ten years, the middle-income renter pool remains sizable. In fact, the proportion of middle-income earners in the U.S. has remained stable at around 51% of all workers, versus 52% in 2012. However, due to employment and population growth, the absolute number of full-time working earners has substantially increased in that same period. According to data from the Census Bureau and Pew Research, across the 40 largest metropolitan areas, 3.5 million new middle-income earners were added to the workforce over the past decade. Given the sheer size of the pool of working adults in the middle-income bracket—which is growing and constantly being refreshed by new (and younger) workers entering the labor force—Attainable A product is an attractive and affordable option.
Another crucial factor that has recently expanded the growing renter pool, especially for those in the middle, is the declining affordability of single-family homes. Due to the recent increases in interest rates, the average 30-year mortgage rate reached 6.5% in Q4 2022, up from 2.7% in 2020.1 Average home prices have also increased dramatically (33%) over that same two-year period, from $403,900 to $535,800. Assuming a 90% loan-to-cost, 30-year amortizing mortgage, the average monthly mortgage payment is $1,570 higher than average multifamily rents. The widening rent-to-own gap is illustrated in Exhibit 2; the pool of renters is expanding beyond middle-income earners to higher-income earners who may have previously considered buying a home, but can no longer afford to do so.
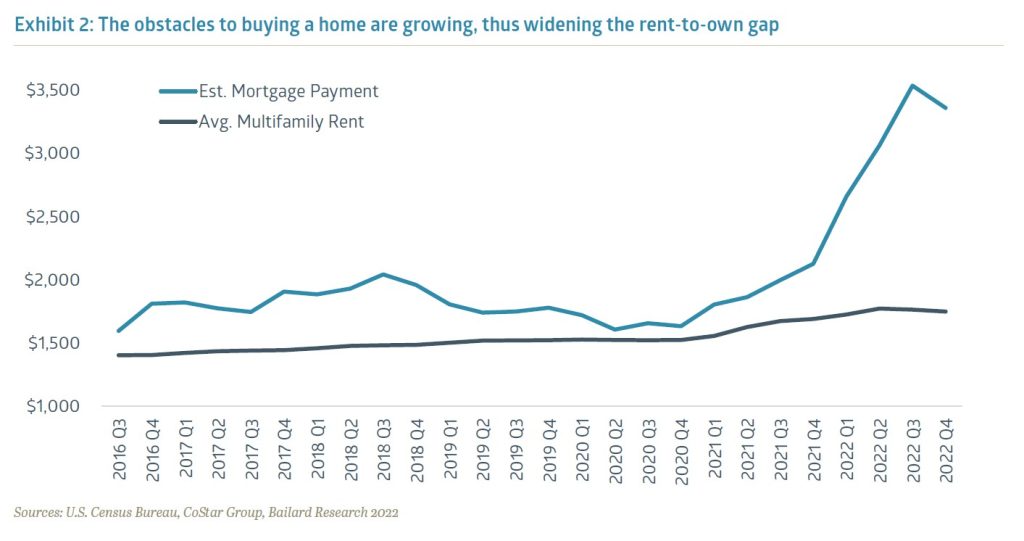 Although the investment case for Attainable A is strong, several factors limit additions to supply. First, homeowners generally fear that multifamily developments could bring undesirable impacts (i.e., traffic, congestion, strain on public services, etc.) and potentially depress surrounding property values. This can result in significant public opposition and/or more regulatory burdens that prevent building new apartments, often in areas that need them. Additionally, it should come as no surprise that elevated construction costs—due to inflated commodity prices, higher labor costs, increased costs for planning, permitting and approvals, and the higher cost of capital—can stand in the way of new multifamily development. According to CBRE Research, construction costs increased by 14.5% in 2022 (vs. 2.8% per year average in the prior ten years).2
Beyond that, local zoning regulations remain resistant to new multifamily projects in favor of single-family housing in nearly every state nationwide. And, last but not least, labor availability has the potential to curtail housing development generally, particularly multifamily construction, as the workforce is not expanding at the rate necessary to meet demand.
Conclusion
Attainable A multifamily properties offer good value within the Class A universe, providing high-quality residential options to millions of renters who either cannot afford, or do not wish to live in, trophy luxury A or luxury A apartments. The Attainable A product segment is well positioned to continue to be a strong performer due to population/demographic trends, favorable supply/demand dynamics, and the unfavorable affordability challenges for single-family home ownership. And, given the expected growth of the target renter pool across the country for the foreseeable future, the need for housing, especially affordable housing, is more acute than ever.
1 https://fred.stlouisfed.org/series/ASPNHSUS , https://fred.stlouisfed.org/series/MORTGAGE30US, CBRE-EA
2 CBRE-EA: Construction Costs Trends, Released November 2022
Economic Brief: Show of Hands
Jon Manchester, CFA, CFP® (Senior Vice President, Chief Strategist – Wealth Management, and Portfolio Manager – Sustainable, Responsible and Impact Investing) explores the quarter’s main themes: the hype (and rise in stock prices) of companies pursuing or enabling AI technology; risk-on in the options and credit markets; and an overall look at the economy.
The corporate version of name-dropping was on full display during fourth quarter earnings season. By definition repetitive, this ritual of reporting earnings every three months can seem like a “check-the-box” exercise. A press release is issued, and then select members of the management team host a call with Wall Street analysts to discuss the results. Generally, the prepared statements start with a raft of disclosures, followed by thanking employees for their hard work, and some sweeping comments meant to say that it was a good quarter in the face of various challenges. For those hardened analysts who follow the company on a daily basis, it can be a lot of white noise. There are, however, certain words or phrases that can pierce the solemnity. The buzziest of which today, of course, is to mention artificial intelligence (AI). These two words seem to have a near mystical way of transforming an otherwise staid affair into an event filled with promise.
This has not escaped executives. According to Goldman Sachs, 36% of companies in the Standard & Poor’s 500 Index discussed AI on their Q4 earnings calls, a new high.1 Over 80% of Tech sector companies mentioned AI, not surprisingly, but the prevalence is expanding in other areas. The Energy sector saw the largest increase in the percentage of companies mentioning AI, buoyed by a push to automate processes and analyze vast reams of data. Elsewhere, Bank of New York Mellon Corp said they are using AI to do mundane tasks and noted that AI is saving their research team two hours a day by harvesting data and assembling a rough draft of research communications. Procter & Gamble is using AI tools to optimize truck scheduling, fill rates, routing, and sourcing, which they identified as a combined $200 million to $300 million savings opportunity. Investors and analysts alike can embrace a slimmed down cost structure, which enables more revenues to drop to the bottom line. For some firms AI is a revenue opportunity (see: NVIDIA), while for others it might be a way to run leaner and squeeze more profits out of the same business.
Yield Or Yield Not
For all of these direct or indirect beneficiaries of AI spend, analysts face an ongoing challenge to estimate both the size and duration of the AI revenue streams. In the meantime, investors aren’t waiting to catch a later train. In fact, some are resorting to unusual measures, Convertible bonds normally offer a positive interest rate in addition to the right to convert the bonds to equity shares at a set price. In March, San Jose, California-based Super Micro Computer rode a more than 1,000% AI-stoked rally over the trailing 12 months into a coveted spot in the S&P 500 Index. A leading provider of high-performance AI servers, Super Micro issued convertible debt in February with a 0% interest rate, and the yield quickly traded into negative territory, finishing the quarter at -2.1%. In other words, investors are paying for the privilege of lending money to Super Micro, the inverse of the typical arrangement. They do, however, have the carrot of potentially converting the bonds to equity shares by February 2029, which could prove worthwhile if the stock price continues to ascend.
Options trading is another area of the capital markets full of pep. In March, options volumes on U.S. single stocks exceeded trading volumes on the underlying equities for the first time since 2021.3 Technology stocks dominated the options leaderboard by absolute volumes, and options on companies involved with AI or cryptocurrencies proved a flytrap for investors buzzing around those themes. Super Micro’s average three-month options volumes equated to an astonishing 22% of the stock’s market capitalization as of mid-March, the highest percentage on that metric for the trailing three-month period, according to Goldman Sachs Derivatives Research. This is all a bit reminiscent of 2021, when meme stocks, options, and cryptocurrencies were running hot. Barron’s recently suggested the options market is in the throes of a speculative mania, due in large part to heavy trading on options that expire in under a week.4 That includes same-day expirations, also known as zero days to expiration (0DTE), and Barron’s sees echoes of the 1920’s bucket shops that enabled people to gamble on stock price changes without owning shares. Speculation is admittedly nothing new in financial markets, always burning at the edges of town, but has a bad habit of causing more widespread damage when the winds are right.
Not to be outdone, the credit markets have likewise adopted a risk-on approach. With the Federal Reserve still expected to begin reducing the Fed Funds target range during 2024, and an economic “soft landing” or even no-landing viewed as in the works, investors feel emboldened to chase higher yields offered by lower-rated corporate issuers. The Barclays Capital U.S. Corporate High Yield Index spread over the 10-year U.S. Treasury Note yield declined to 346 basis points (bp) at the end of Q1. A year prior, that spread was 502 bps, close to the average of the last three decades. A Bloomberg piece said credit markets are acting like the go-go days of the easy money era are back again.5 Issuers with ratings deep into junk territory are returning to market and meeting strong demand, the article notes. The environment remains favorable, with default rates staying low. JPMorgan’s data puts the trailing 12-month U.S. high yield default rate at just 1.66% versus a 25-year average of 3.00%.6 With almost no room for improvement, reaching for yield down the credit spectrum may not pay off, particularly considering the availability of risk-free rates north of 5% at the short end of the Treasury yield curve.
The Simple Bare Necessities
Personification is a figure of speech, in which objects are given human traits. The next time you dine out with friends, for example, you might say the crème brûlée is calling your name. Although not literally true, it’s fun to imagine the siren call of the dessert menu. If we were to choose one word to describe inflation at present, stubborn seems to be the adjective of choice. After peaking at 9.1% year-over-year growth in June 2022, the Consumer Price Index (CPI) decelerated to just a 3.0% rate a year later. Since then, progress has stalled, leaving CPI up 3.2% year over year in February 2024. The Fed’s favored inflation metric, the Personal Consumption Expenditures (PCE) Core Index, was a little less stubborn, ringing in an increase of 2.8% year over year in February.
This has complicated decision-making for the Fed, and delayed the highly-anticipated pivot to easier monetary policy. Fed chairman Jerome Powell acknowledged the pickle they are in during his March 2024 press conference: “We know that reducing policy restraint too soon or too much could result in a reversal of the progress we have seen on inflation and ultimately require even tighter policy to get inflation back to two percent. At the same time, reducing policy restraint too late or too little could unduly weaken economic activity and employment.”7 Eight months past the last Fed Funds rate hike, economic data has largely remained solid. The unemployment rate has stuck under the 4% mark since January 2022. Gross Domestic Product (GDP) grew 3.1% inflation-adjusted in 2023, and the median Fed projection expects a little over 2% growth this year. Existing home sales jumped 9.5% in February 2024, an encouraging sign amidst elevated mortgage rates.
There are pockets of weakness. The Institute for Supply Management (ISM) monthly manufacturing survey posted a 16th-consecutive contractionary month in February, before finally creeping into expansion territory in March. Similarly, the Conference Board’s Leading Economic Indicators (LEI) Index managed a 0.1% month-over-month increase in February, snapping a nearly two-year journey in negative territory. Still, no recession, and perhaps it doesn’t need to be complicated. Consumers are employed, with added tailwinds from the financial markets, steady housing prices, and well-anchored inflation expectations.
Equity valuations for the largest U.S. companies seem to fully discount the “good enough” economy and the Fed pivot potential. Estimated S&P 500 Index operating earnings for 2024 actually slightly decreased during Q1, dropping from $242 per share at the outset to $240 at quarter end.8 Combined with a 10% price increase, the Index’s forward valuation was two points higher at nearly 22x at quarter end, driven up by those large Tech companies riding the AI wave. In comparison, the S&P 500 Equal Weighted Index trades at 17x, a better gauge of pricing for the average stock. Lower interest rates should be supportive of elevated valuations, assuming the Fed is able to avoid the “too late or too little” potholes. Ultimately, corporations will need to prove they can grow profits at a fast enough clip to justify market expectations, with or without a little help from their new AI friends.
1 “3 themes from 4Q 2023 conference calls: AI, supply chains, and the labor market,” Goldman Sachs S&P 500 Beige Book, 2/14/24.
2 “Reddit Eases Back After IPO Popped. There Are Still Challenges Ahead for Ad, AI Push.” Investor’s Business Daily, 3/22/24.
3 The Twenty US Stocks where Options Volumes Matter Most,” Goldman Sachs Derivatives Research, 3/13/24.
4 The Latest Options Craze Resembles Past Manias. That’s Not a Good Thing.” www.barrons.com, 3/20/24.
5 “Credit Markets Are Acting Like Easy Money Era Never Ended,” www.bloomberg.com, 3/8/24.
6 JPMorgan Asset Management “Guide to the Markets,” 3/11/24.
7 “Transcript of Chair Powell’s Press Conference,” www.federalreserve.gov, 3/20/24.
8 “S&P 500 Earnings and Estimate Report,” www.spglobal.com, 3/21/24.